Hello I am doing an assignment that is due tomorrow and I was hoping that someone can help me with this code since the code I only find online is a different python that I haven't learned yet. The code I am seeing that does not work in my program is the one with table().with_column, .item, .sort, .select, and .index_by. I am sorry but I dont know what type of code this is but please do not use any of these commands in the answer because it also doesn't work in my program which is anaconda jupyter notebook which i have been using to write python code.
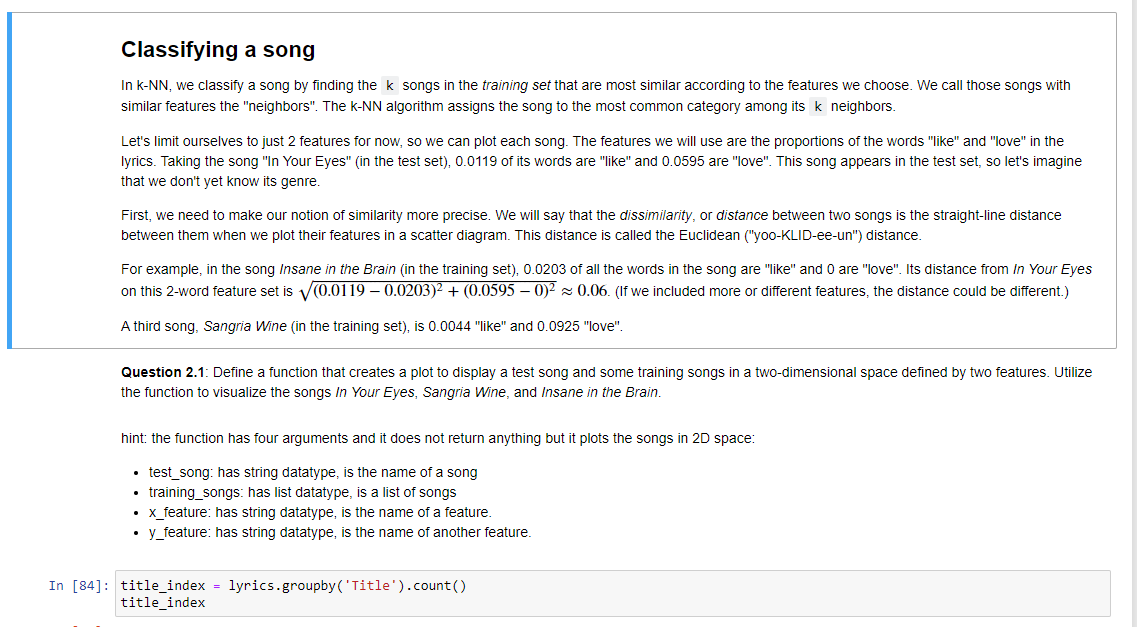
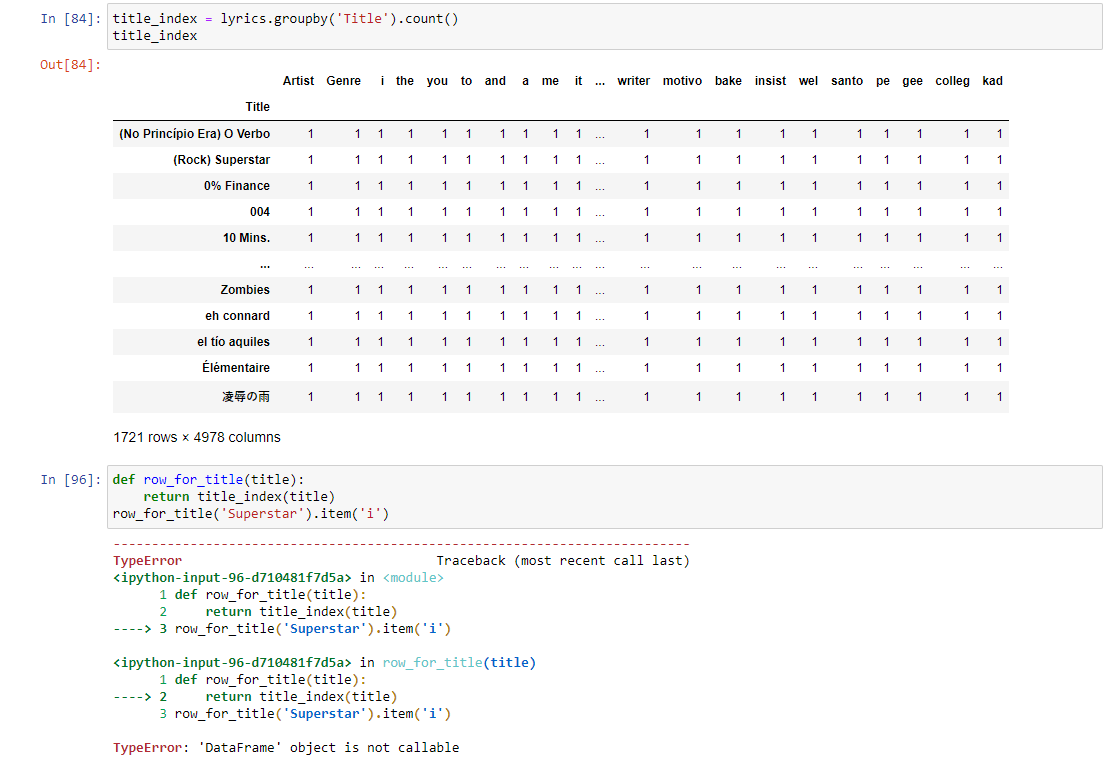
Classifying a song In kNN, we classify a song by nding the k songs in the framing set that are most simtlar according to the features we choose. We call those songs with similar features the \"neighbors". The k-NN algorithm assigns the song to the most common category among its k neighbors. Let's limit ourselves to just 2 features for now, so we can plot each song. The features we will use are the proportions of the words "like" and "love" in the lyrics. Taking the song "In Your Eyes" (in the test set), 0.0119 of its words are "like" and 0.0595 are "love". This song appears in the test set, so let's imagine that we don't yet Know its genre. First, we need to make our notion of similarity more precise. We will say that the dissimr'iarity, or distance between two songs is the straightline distance between them when we plot their features in a scatter diagram. This distance is called the Euclidean ('yoo-KLIDeeun") distance. For example, in the song insane in the Brain (in the training set), 0.0203 of all the words in the song are "like" and 0 are "love". Its distance from in Your Eyes on this 2word feature set is 1:10.01 19 0.0203)2 + (0.0595 0)2 z 0.06. (If we included more or different features, the distance could be different.) A third song, Sangria Wine (in the training set), is 0.0044 "like" and 0.0925 "love". In [84]: Question 2.1: Dene a function that creates a plot to display a test song and some training songs in a twooimensional space dened by two features. Utilize the function to visualize the songs in Your Eyes, Sangria Wine, and insane in the Brain. htnt: the function has four arguments and it does not return anything but it plots the songs in 20 space: - test_song: has string datatype, is the name of a song - training_songs: has list datatype, t5 a list of songs - x_feature: has string datatype, is the name of a feature. - y_feature: has string datatype. is the name of another feature. tit1e_index = lyrics.groupby( 'Title ') .count() tit1e_index In [84]: title_index = lyrics. groupby( 'Title' ) . count() title_index Out [84] : e it ... writer motivo bake insist wel santo pe gee college kad Artist Genre i the you to and a me Title (No Principio Era) O Verbo (Rock) Superstar 0% Finance 1 004 1 1 1 1 1 1 1 ... 10 Mins. .. . ... ... . . . . .. .. . . . . . . 1 1 1 1 1 1 .-. Zombies 1 1 1 1 eh connard 1 1 1 1 1 1 1 1 1 .. . el tio aquiles 1 1 1 1 1 1 .. . Elementaire 1 ... 1721 rows x 4978 columns In [96]: def row_for_title(title): return title_index(title) row_for_title( ' Superstar' ) . item( 'i' ) Traceback (most recent call last) TypeError
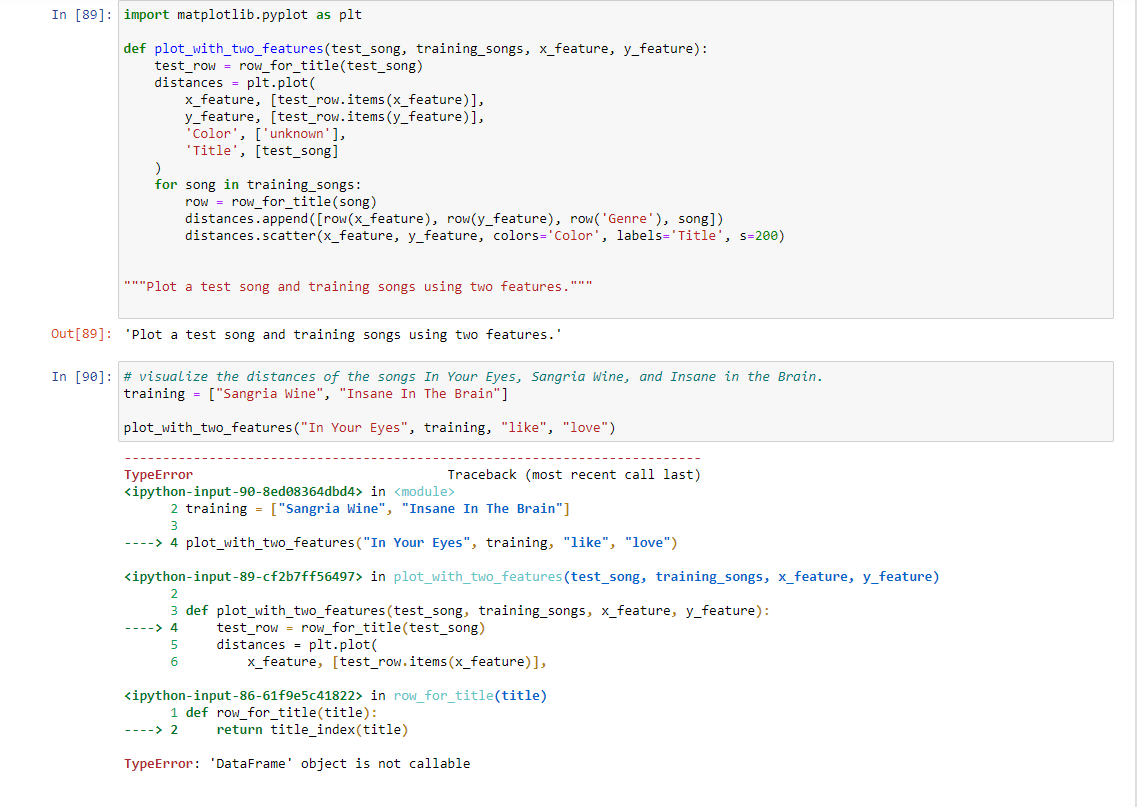
in 1 def row_for_title(title): 2 return title_index(title) - ---> 3 row_for_title( 'Superstar' ) . item('i' ) in row_for_title(title) 1 def row_for_title(title): ---> 2 return title_index(title) 3 row_for_title( 'Superstar' ) . item('i' ) TypeError: 'DataFrame' object is not callableIn [89]: import matplotlib. pyplot as plt def plot_with_two_features (test_song, training_songs, x_feature, y_feature): test_row = row_for_title(test_song) distances = plt. plot( x_feature, [test_row. items (x_feature) ], y_feature, [test_row. items (y_feature) ], 'Color' , [' unknown' ], Title', [test_song] for song in training_songs: row = now_for_title (song) distances . append ( [row(x_feature), row(y_feature), row( 'Genre' ), song]) distances . scatter (x_feature, y_feature, colors='Color', labels='Title', s=200) """Plot a test song and training songs using two features.""" Out [89]: 'Plot a test song and training songs using two features." In [90]: # visualize the distances of the songs In Your Eyes, Sangria Wine, and Insane in the Brain. training = ["Sangria Wine", "Insane In The Brain"] plot_with_two_features ("In Your Eyes", training, "like", "love") TypeError Traceback (most recent call last) in 2 training = ["Sangria Wine", "Insane In The Brain" ] ---> 4 plot_with_two_features("In Your Eyes", training, "like", "love") in plot_with_two_features (test_song, training_songs, x_feature, y_feature) 2 def plot_with_two_features (test_song, training_songs, x_feature, y_feature): - - - -> 4 test_row = row_for_title(test_song) distances = plt.plot( x_feature, [test_row. items (x_feature) ], in row_for_title(title) 1 def row_for_title(title): 2 return title_index(title) TypeError: 'DataFrame' object is not callable


