

Question: Hello, i am not sure whether to put this under computer science or civil engineering since it is MATLAB. I am having trouble trying to
Hello, i am not sure whether to put this under computer science or civil engineering since it is MATLAB. I am having trouble trying to understand how to start this and plot it using title and header and so forth. out TA didnt specify any good examples during lecture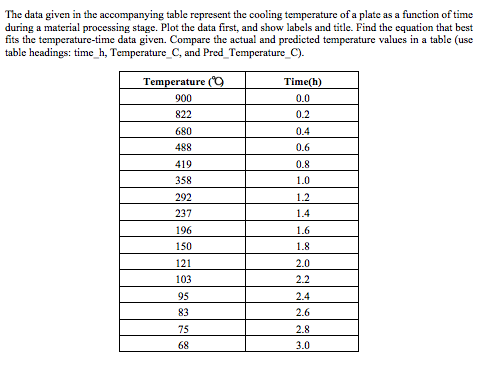
The data given in the accompanying table represent the cooling temperature of a plate as a function of time during a material processing stage. Plot the data first, and show labels and title. Find the equation that best fits the temperature-time data given. Compare the actual and predicted temperature values in a table (use table headings: time h, Temperature C, and Pred Temperature C). Time(h) 0.0 0.2 0.4 0.6 0.8 Temperature 900 822 680 488 419 358 292 237 196 150 121 103 95 83 75 68 1.2 2.0 2.2 2.4 2.6 2.8 3.0
Step by Step Solution
There are 3 Steps involved in it

Get step-by-step solutions from verified subject matter experts