Question
Hello, I am re-asking this question for the fifth time because I have not received any answer to this with good explanation.I would like questions
Hello, I am re-asking this question for the fifth time because I have not received any answer to this with good explanation.I would like questions 1-3 to be answered. For the calculation part, I would like a step by step working out for each of the solutions. I am doing this manually, so I need a clear step by step on how you got the answer for each of the section. I don't want just an explanation or formula given to me. thank
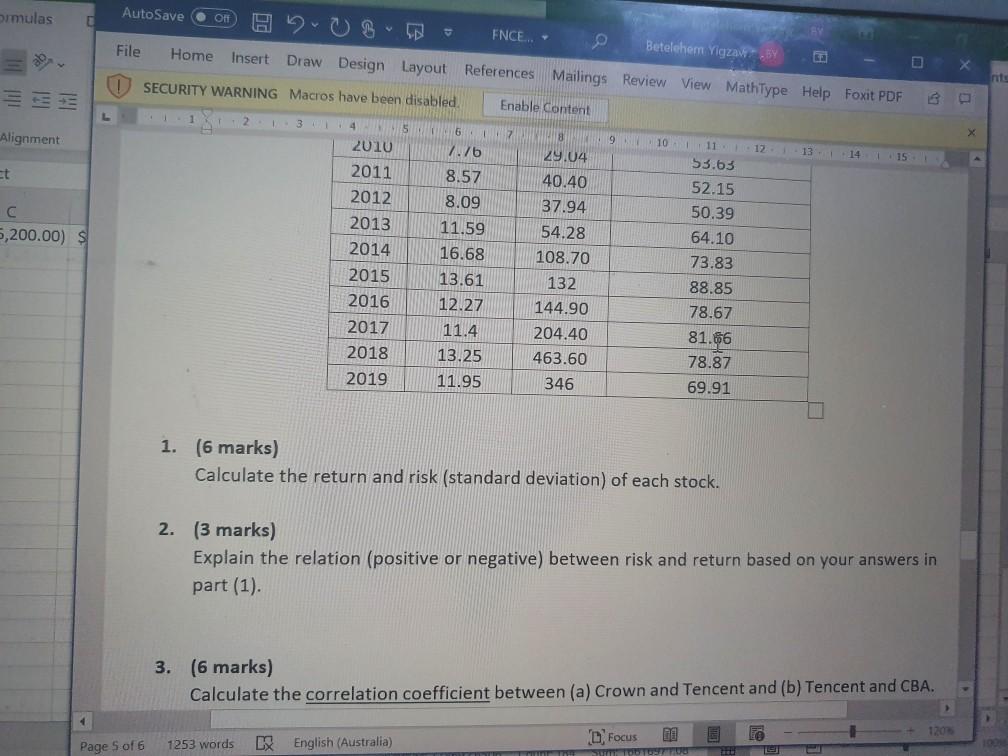
I am reposting the picture because it requires me to if I want to add for information. When I say I am doing this manually I mean I am using the basic calculator not a finance one. so I need step by step by step for each stage of working out Thank you
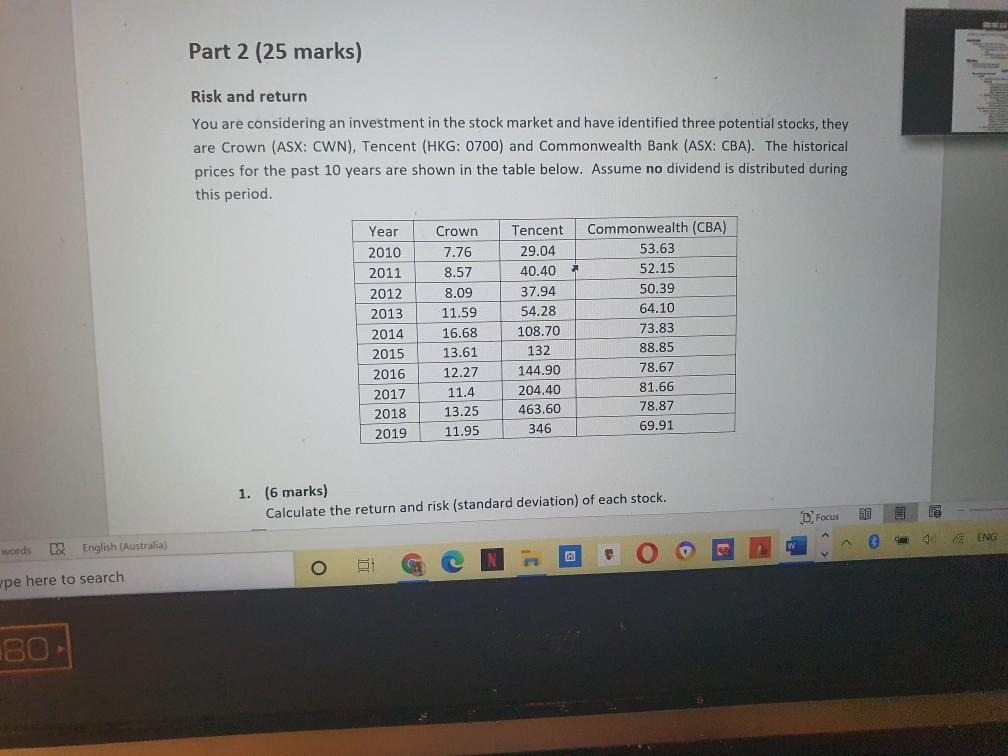
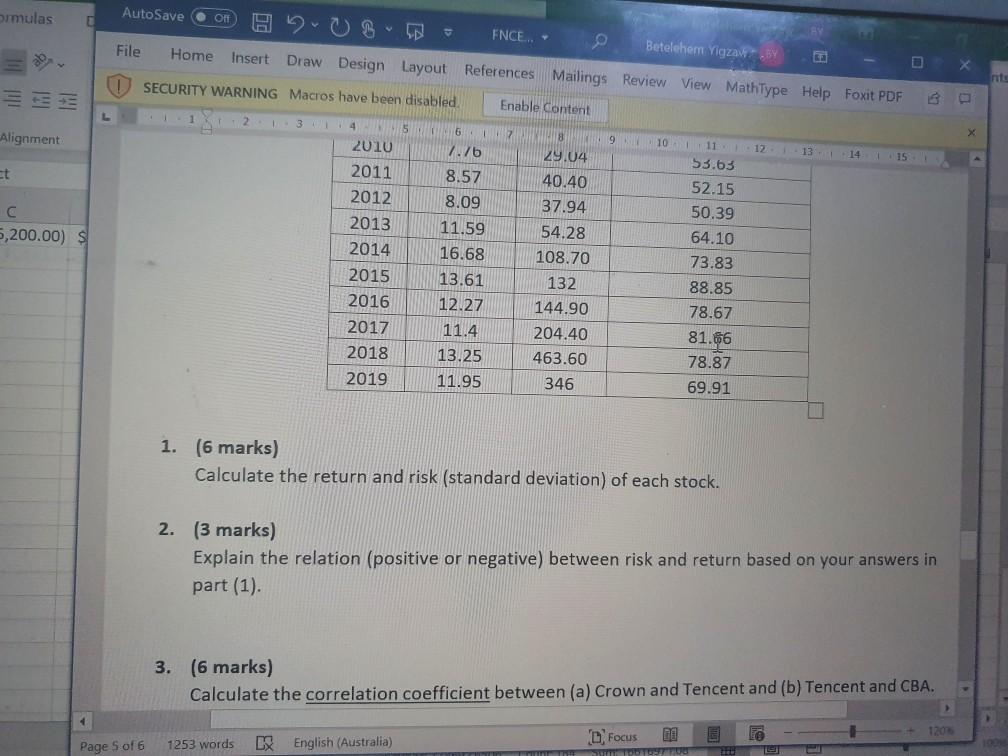
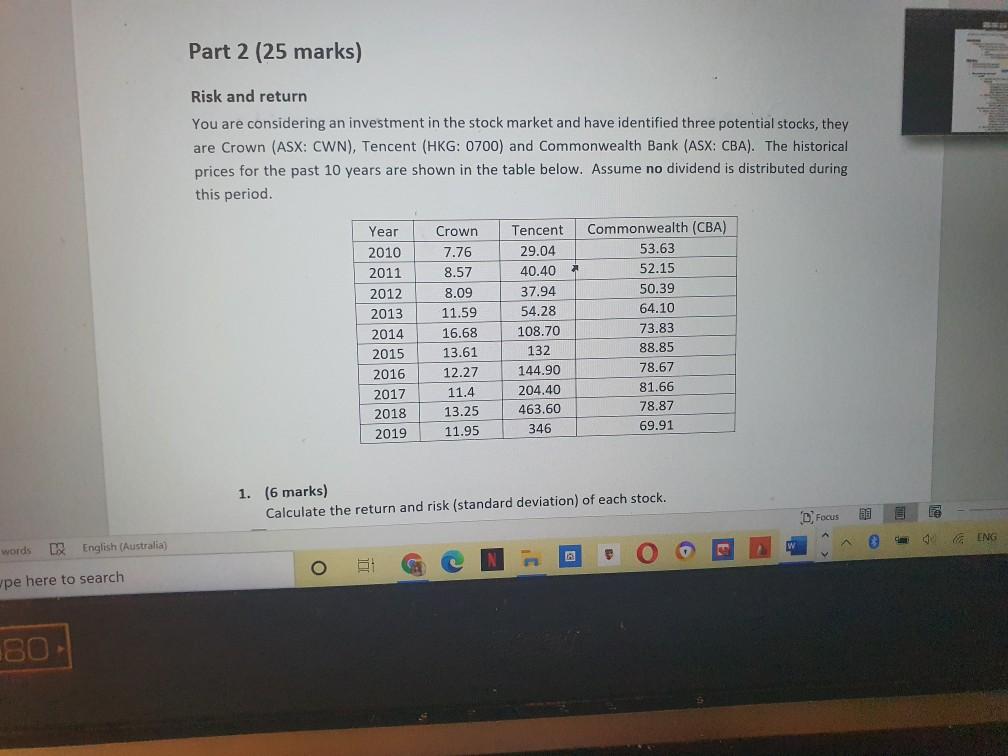
Part 2 (25 marks) Risk and return You are considering an investment in the stock market and have identified three potential stocks, they are Crown (ASX: CWN), Tencent (HKG: 0700) and Commonwealth Bank (ASX: CBA). The historical prices for the past 10 years are shown in the table below. Assume no dividend is distributed during this period. Year 2010 2011 2012 2013 2014 2015 2016 2017 2018 2019 Crown 7.76 8.57 8.09 11.59 16.68 13.61 12.27 11.4 13.25 11.95 Tencent 29.04 40.40 37.94 54.28 108.70 132 144.90 204.40 463.60 346 Commonwealth (CBA) 53.63 52.15 50.39 64.10 73.83 88.85 78.67 81.66 78.87 69.91 1. (6 marks) Calculate the return and risk (standard deviation) of each stock. D. Focus ENG words DE English (Australia) O wpe here to search 80 Ormulas AutoSave Off FNCE... - File Betelehem Yigzawy? BY int 3 X Alignment 10 12 Et 8.09 C 5,200.00) $ Home Insert Draw Design Layout References Mailings Review View MathType Help Foxit PDF SECURITY WARNING Macros have been disabled Enable content 2 4 5 6 9 11 1 2010 13 14 15 7.76 29.04 53.63 2011 8.57 40.40 52.15 2012 37.94 50.39 2013 11.59 54.28 64.10 2014 16.68 108.70 73.83 2015 13.61 132 88.85 2016 12.27 144.90 78.67 2017 11.4 204.40 81.66 2018 13.25 463.60 78.87 2019 11.95 346 69.91 1. (6 marks) Calculate the return and risk (standard deviation) of each stock. 2. (3 marks) Explain the relation (positive or negative) between risk and return based on your answers in part (1) 3. (6 marks) Calculate the correlation coefficient between (a) Crown and Tencent and (b) Tencent and CBA. 1 120 Page 5 of 6 1253 words LX English (Australia) L. Focus TODOS OS Ormulas AutoSave Off FNCE... - File Betelehem Yigzawy? BY int 3 X Alignment 10 12 Et 8.09 C 5,200.00) $ Home Insert Draw Design Layout References Mailings Review View MathType Help Foxit PDF SECURITY WARNING Macros have been disabled Enable content 2 4 5 6 9 11 1 2010 13 14 15 7.76 29.04 53.63 2011 8.57 40.40 52.15 2012 37.94 50.39 2013 11.59 54.28 64.10 2014 16.68 108.70 73.83 2015 13.61 132 88.85 2016 12.27 144.90 78.67 2017 11.4 204.40 81.66 2018 13.25 463.60 78.87 2019 11.95 346 69.91 1. (6 marks) Calculate the return and risk (standard deviation) of each stock. 2. (3 marks) Explain the relation (positive or negative) between risk and return based on your answers in part (1) 3. (6 marks) Calculate the correlation coefficient between (a) Crown and Tencent and (b) Tencent and CBA. 1 120 Page 5 of 6 1253 words LX English (Australia) L. Focus TODOS OSStep by Step Solution
There are 3 Steps involved in it
Step: 1

Get Instant Access to Expert-Tailored Solutions
See step-by-step solutions with expert insights and AI powered tools for academic success
Step: 2

Step: 3

Ace Your Homework with AI
Get the answers you need in no time with our AI-driven, step-by-step assistance
Get Started


