

Question
Hello I am struggling to calculate f(m-x bar)2 and other question mentioned below This table shows the distribution of winning times in the Kentucky Derby
Hello
I am struggling to calculate f(m-x bar)2 and other question mentioned below
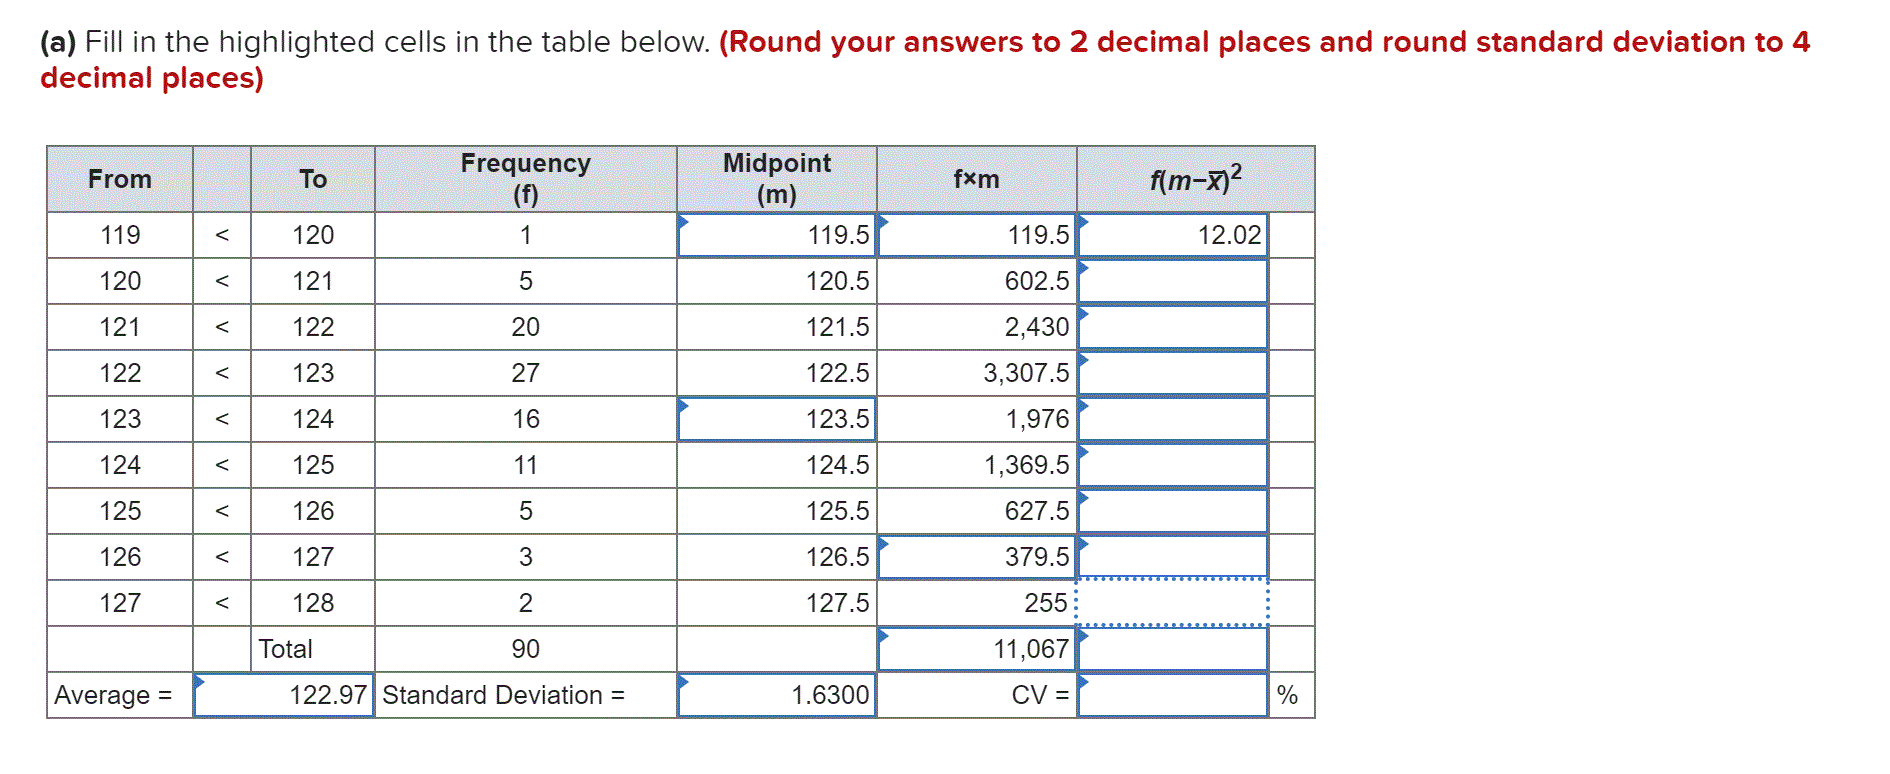
This table shows the distribution of winning times in the Kentucky Derby (a horse race) over 90 years.
| Kentucky Derby Winning Times, 1930 to 2019 (seconds) | |||
| From | To | f | |
|---|---|---|---|
| 119 | 120 | 1 | |
| 120 | 121 | 5 | |
| 121 | 122 | 20 | |
| 122 | 123 | 27 | |
| 123 | 124 | 16 | |
| 124 | 125 | 11 | |
| 125 | 126 | 5 | |
| 126 | 127 | 3 | |
| 127 | 128 | 2 | |
| Total | 90 | ||
Click here for the Excel Data File (a) Fill in the highlighted cells in the table below. (Round your answers to 2 decimal places and round standard deviation to 4 decimal places)
(b) State whether the following statement is True or False? The raw data would show us the years when the winning times were much longer than the average.
multiple choice 1
-
True
-
False
(c-1) Do you think it likely that the distribution of times within each interval might not be uniform? multiple choice 2
-
Yes
-
No
(c-2) This distribution appears to be: multiple choice 3
-
Symmetric
-
Skewed right
-
Skewed left
Step by Step Solution
There are 3 Steps involved in it
Step: 1

Get Instant Access to Expert-Tailored Solutions
See step-by-step solutions with expert insights and AI powered tools for academic success
Step: 2

Step: 3
Ace Your Homework with AI
Get the answers you need in no time with our AI-driven, step-by-step assistance
Get Started
Investments Analysis And Management
Authors: Charles Jones, Nick Jones
11th Edition
0470477121, 9780470477120