Hello, I am taking statistics class for first time and am overwhelmed and do not understand how to get to those answers.... The image attached below is the result of the test from SPSS.
Question 1: Please invest the relationship between child (antisocial behavior: antisoc) and (academic performance: achieve) and answer those small required sections below.
Correlation
1a.) What are the assumptions of correlation?
1b.) Name the assumptions and check all that you are capable of checking.
1c.) Are your assumptions met?
1d.) Based on the correlation you've run (images below), how would you describe this relationship?
Regression
1e.) Is antisocial behavior a predictive of academic performance?
1f.) Interpret the results of your analysis (cite all relevant statistics for how well does the model fit and are all variables important?).
1g.) Create a scattererplot of the residuals (how do I do this).
1h.) What are the assumptions for regression?
1i.) Are your assumptions met?
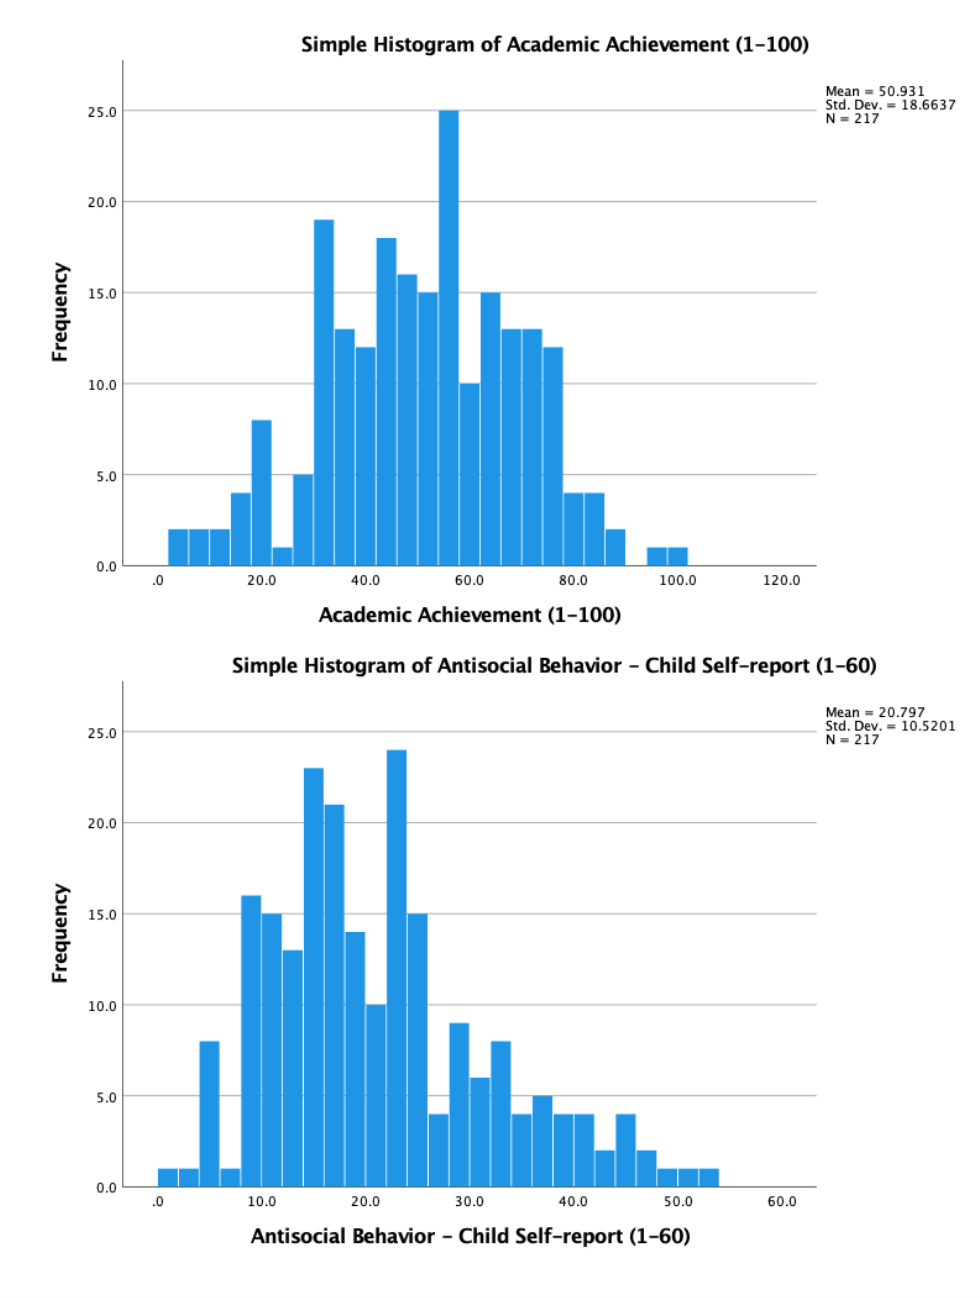
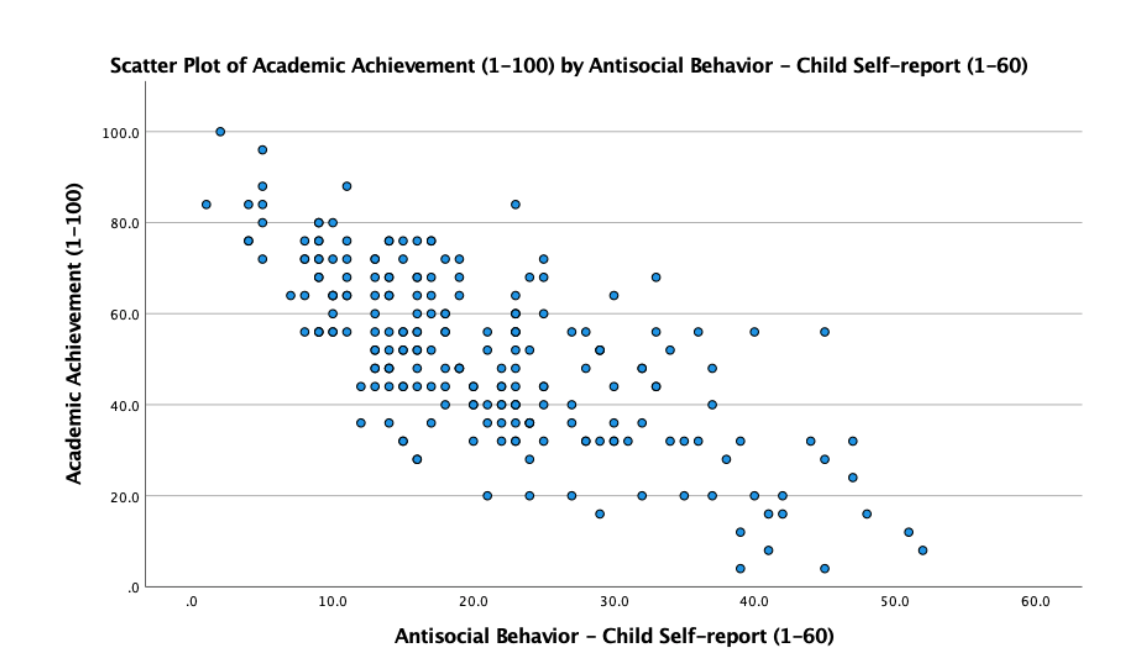
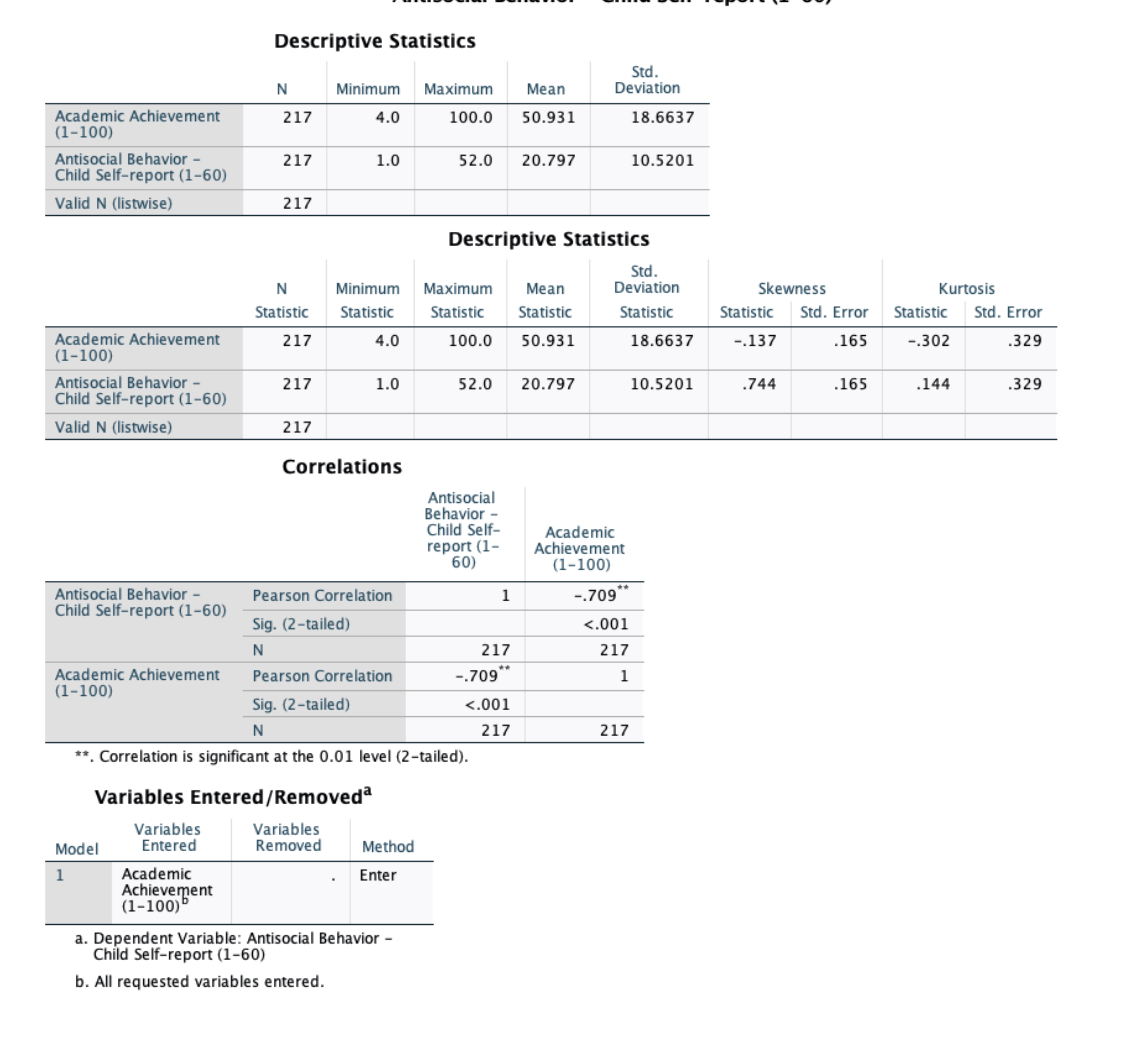
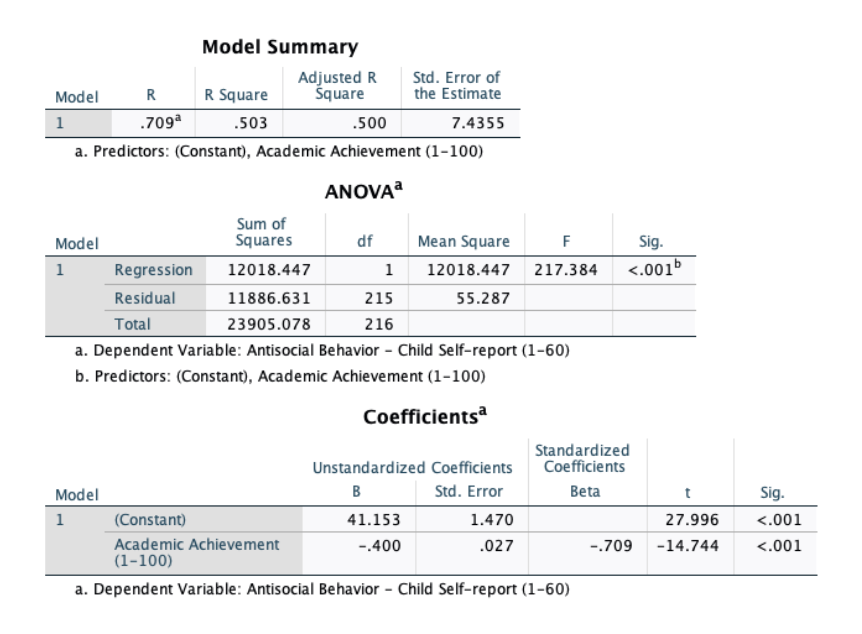
Descriptive Statistics Std. N Minimum Maximum Mean Deviation Skewness Kurtosis Statistic Statistic Statistic Statistic Statistic Statistic Std. Error Statistic Std. Error Academic Achievement 217 4.0 100.0 50.931 18.6637 -.137 165 -.302 .329 (1-100) Antisocial Behavior - 217 1.0 52.0 20.797 10.5201 .744 .165 .144 .329 Child Self-report (1-60) Valid N (listwise) 217Simple Histogram of Academic Achievement (1-100) Mean = 50.931 25.0 Std. Dev. = 18.6637 N = 217 20.0 15.0 Frequency 10.0 5.0 0.0 .0 20.0 40.0 60.0 80.0 100.0 120.0 Academic Achievement (1-100) Simple Histogram of Antisocial Behavior - Child Self-report (1-60) Mean = 20.797 25.0 Std. Dev. = 10.5201 N = 217 20.0 15.0 Frequency 10.0 5.0 O.C .0 10.0 20.0 30.0 40.0 50.0 60.0 Antisocial Behavior - Child Self-report (1-60)Scatter Plot of Academic Achievement (1-100) by Antisocial Behavior - Child Self-report (1-60) 100.0 Oo 80.0 OO O C O OO OO OO 60.0 O O O . Academic Achievement (1-100) O 40.0 20.0 ,0 .0 10.0 20.0 30.0 40.0 50.0 60.0 Antisocial Behavior - Child Self-report (1-60)Descriptive Statistics Std. N Minimum Maximum Mean Deviation Academic Achievement 217 4.0 100.0 50.931 18.6637 (1-100) Antisocial Behavior - 217 1.0 52.0 20.797 10.5201 Child Self-report (1-60) Valid N (listwise) 217 Descriptive Statistics Std. Minimum Maximum Mean Deviation Skewness Kurtosis Statistic Statistic Statistic Statistic Statistic Statistic Std. Error Statistic Std. Error Academic Achievement 217 4.0 100.0 50.931 18.6637 .137 165 -.302 .329 (1-100) Antisocial Behavior - 217 1.0 52.0 20.797 10.5201 744 .165 144 .329 Child Self-report (1-60) Valid N (listwise) 217 Correlations Antisocial Behavior - Child Self- Academic report (1- Achievement 60) (1-100) Antisocial Behavior - Pearson Correlation 1 -.709 Child Self-report (1-60) Sig. (2-tailed) <.001 n academic achievement pearson correlation sig. is significant at the level variables entered model removed method enter a. dependent variable: antisocial behavior child self-report b. all requested entered.model summary adjusted r std. error of square estimate .503 predictors: anovaa sum squares df mean f regression residual total coefficients standardized unstandardized b beta sig .027>