Hello, I completed this analysis, could you please verify it is math/statistically/ comprehensive correct?
Introduction
The coach of the team and management have requested to come up with regression models that predict the total number of wins for a team in the regular season based on key performance metrics, utilizing the same data used in the previous projects. These regression models will help make key decisions to improve the performance of the team. Python programming language is to be used to perform statistical analysis. A report of findings to the team's management is mandatory. Since the managers are not data analysts, the findings interpretation and description's tone must be practical and easy to follow.
2. Data Preparation
There are four important variables in the selected data set:
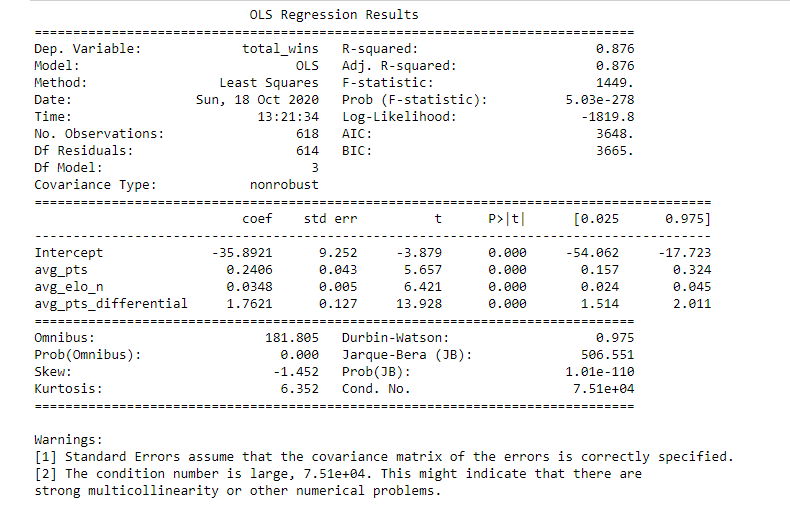
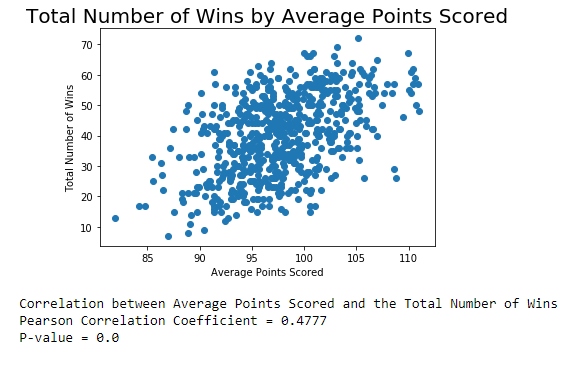
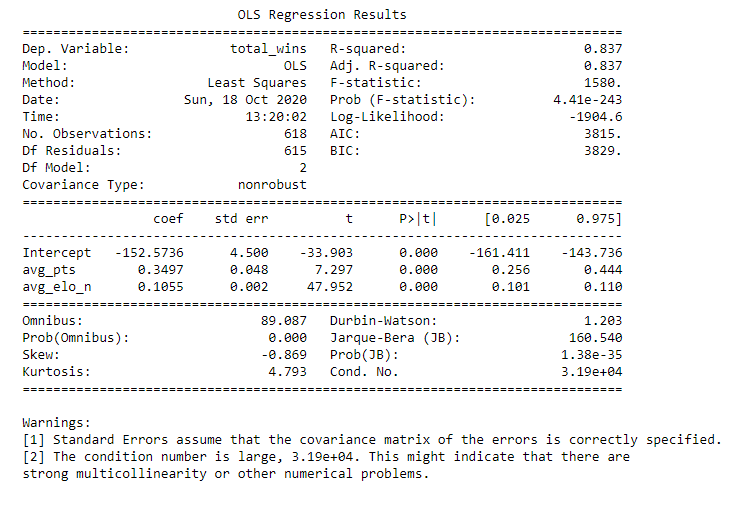
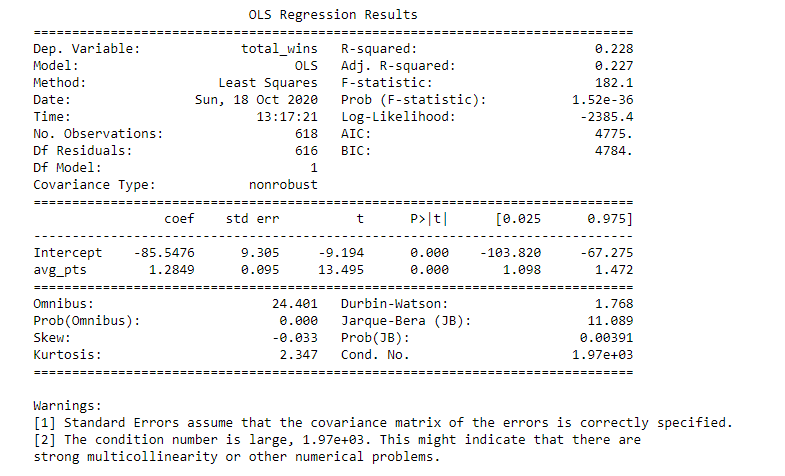
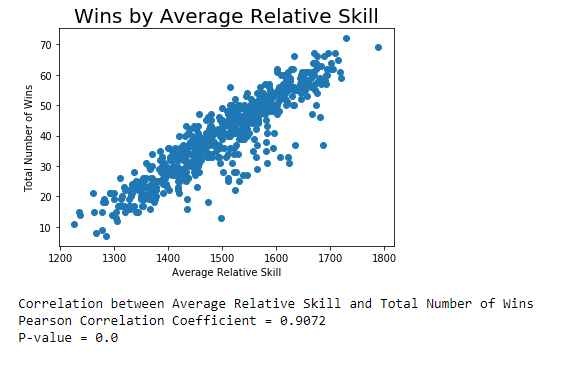
OLS Regression Results Dep. Variable: total wins R-squared: 9.876 Model : OLS Adj. R-squared: 0.876 Method : Least Squares F-statistic: 1449. Date: Sun, 18 Oct 2020 Prob (F-statistic): 5. 03e-278 Time : 13 : 21:34 Log-Likelihood: -1819.8 No. Observations: 618 AIC : 3648. Of Residuals: 614 BIC : 3665. Of Model: 3 Covariance Type: nonrobust coef std err t P> t [0. 025 0.975] Intercept -35. 8921 9 .252 -3.879 0.000 -54.062 -17.723 avg_pts 0. 2406 0.043 5.657 0.000 0. 157 0.324 avg_elo_n 0.0348 0.005 6.421 0.000 0. 024 0. 045 avg_pts_differential 1. 7621 0. 127 13.928 0.000 1. 514 2. 011 Omnibus : 181. 805 Durbin-Watson : 0.975 Prob(Omnibus ) : 0.006 Jarque-Bera (JB) : 506 . 551 Skew: -1. 452 Prob (JB) : 1. 01e-110 Kurtosis : 6.352 Cond. No. 7.51e+04 Warnings : [1] Standard Errors assume that the covariance matrix of the errors is correctly specified. [2] The condition number is large, 7.51e+04. This might indicate that there are strong multicollinearity or other numerical problems.Variable What does it represent total wins Total number of wins in a regular season avg_pts Average points scored in a regular season avg_elo n Average relative skill of each team in a regular season avg_pts_differential Average point differential between the team and their opponents in a regular seasonTotal Number of Wins by Average Points Scored 70 60 Total Number of Wins 50 40 30 20 10 85 90 95 100 105 110 Average Points Scored Correlation between Average Points Scored and the Total Number of Wins Pearson Correlation Coefficient = 0.4777 P-value = 0.0OLS Regression Results Dep. Variable: total_wins R-squared : 0.837 Model : OLS Adj. R-squared: 0. 837 Method : Least Squares F-statistic: 1580. Date: Sun, 18 Oct 2020 Prob (F-statistic) : 4. 41e-243 Time : 13: 20:02 Log-Likelihood: -1904.6 No. Observations: 618 AIC : 3815. Df Residuals: 615 BIC: 3829. Df Model : 2 Covariance Type: nonrobust coef std err t P> t [0. 025 0.975] Intercept -152.5736 4.500 -33.903 0.000 -161. 411 -143.736 avg_pts 0. 3497 0. 048 7.297 0.006 0. 256 0.444 avg_elo_n 0. 1055 0. 002 47.952 0.060 0. 101 0. 110 Omnibus : 89 . 087 Durbin-Watson : 1. 203 Prob (Omnibus ) : 0.060 Jarque -Bera (JB) : 160.540 Skew: -0.869 Prob(JB) : 1.38e-35 Kurtosis : 4.793 Cond. No. 3.19e+04 Warnings : [1] Standard Errors assume that the covariance matrix of the errors is correctly specified. [2] The condition number is large, 3.19e+04. This might indicate that there are strong multicollinearity or other numerical problems.OLS Regression Results = =: Dep. Variable: total wins R-squared: 0 . 228 Model : OLS Adj. R-squared: 0.227 Method : Least Squares F-statistic: 182. 1 Date: Sun, 18 Oct 2020 Prob (F-statistic): 1.52e-36 Time : 13: 17 :21 Log- Likelihood: -2385.4 No. Observations: 618 AIC ; 4775. Of Residuals : 616 BIC : 4784. Df Model : 1 Covariance Type: nonrobust coet std err t P> t [0. 025 0.975] Intercept -85.5476 9.305 -9.194 3.000 -103.820 -67.275 avg_pts 1. 2849 0. 095 13. 495 0.060 1.098 1.472 Omnibus : 24.401 Durbin-Watson: 1.768 Prob (Omnibus ) : 0.000 Jarque -Bera (JB) : 11. 089 Skew: -0.033 Prob(JB) : 0. 00391 Kurtosis : 2.347 Cond. No. 1.97e+03 Warnings : [1] Standard Errors assume that the covariance matrix of the errors is correctly specified. [2] The condition number is large, 1.97e+03. This might indicate that there are strong multicollinearity or other numerical problems.year id fran id avg_pts avg_opp_pts avg_elo n avg_opp_elon avg_pts_differential avg_elo_differential total wins 0 1995 Bucks 99.341463 103.707317 1368.604789 1497.311587 -4.365854 -128.706798 34 7 1995 Bulls 101.524390 96.695122 1569.892129 1488. 199352 4.829268 81.692777 47 2 1995 Cavaliers | 90.451220 89.829268 1542.433391 1498.848261 0.621951 43.585130 43 3 1995 Celtics 102.780488 104.658537 1431.307532 1495.936224 -1.878049 -64.628693 35 4 1995 Clippers 96.670732 105.829268 1309.053701 1517.260260 -9.158537 -208.206558 17 printed only the first five observations. .. Number of rows in the dataset = 618Wins by Average Relative Skill 70 60 Total Number of Wins 50 40 30 20 10 1200 1300 1400 1500 1600 1700 1800 Average Relative Skill Correlation between Average Relative Skill and Total Number of Wins Pearson Correlation Coefficient = 0.9072 P-value = 0.0
