Answered step by step
Verified Expert Solution
Question
1 Approved Answer
Hello, I have the following information: Quarterly demand for smartphones at a retailer is as shown. Quarterly demand for smartphones at a retailer is as
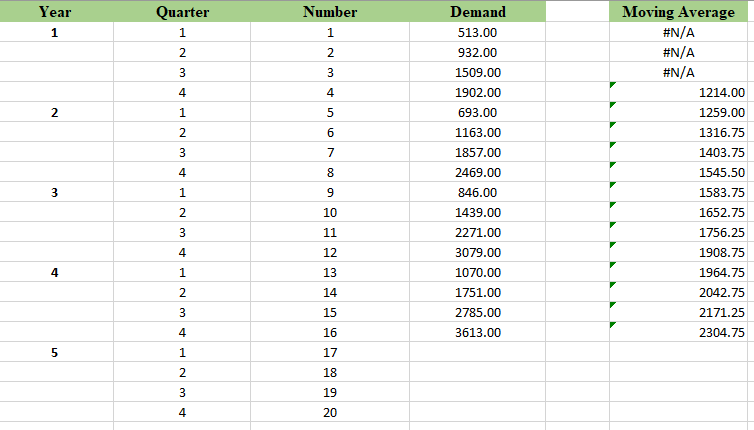
Hello, I have the following information:
Quarterly demand for smartphones at a retailer is as shown.
Quarterly demand for smartphones at a retailer is as shown.
| Year | Quarter | Demand |
| 1 | I | 513 |
| II | 932 | |
| III | 1,509 | |
| IV | 1,902 | |
| 2 | I | 693 |
| II | 1,163 | |
| III | 1,857 | |
| IV | 2,469 | |
| 3 | I | 846 |
| II | 1,439 | |
| III | 2,271 | |
| IV | 3,079 | |
| 4 | I | 1,070 |
| II | 1,751 | |
| III | 2,785 | |
| IV | 3,613 |
Forecast quarterly demand for year 5 using the following models:
- 4-week simple moving average
- Simple exponential smoothing with=0.1
- Trend adjusted exponential smoothing (Holt's model) with=0.1and=0.1
- Linear regression with seasonality
Note: I started and made my chart in excel but there is something wrong and I think that my moving average is not right because I don't know how to move forward with year 5. I would appreciate it if you could help me. Thank you.

Step by Step Solution
There are 3 Steps involved in it
Step: 1

Get Instant Access to Expert-Tailored Solutions
See step-by-step solutions with expert insights and AI powered tools for academic success
Step: 2

Step: 3

Ace Your Homework with AI
Get the answers you need in no time with our AI-driven, step-by-step assistance
Get Started


