

Question
Hello, I just need help filling in the red cells. While my professor gave us the answers, I don't understand how they were derived. Please
Hello, I just need help filling in the red cells. While my professor gave us the answers, I don't understand how they were derived. Please show all formulas used!
*Anything that is blurry becomes clearer once zoomed in*
Thank you in advance
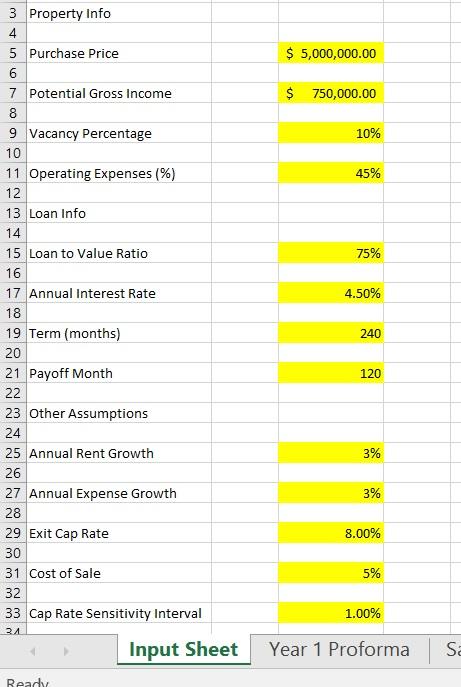
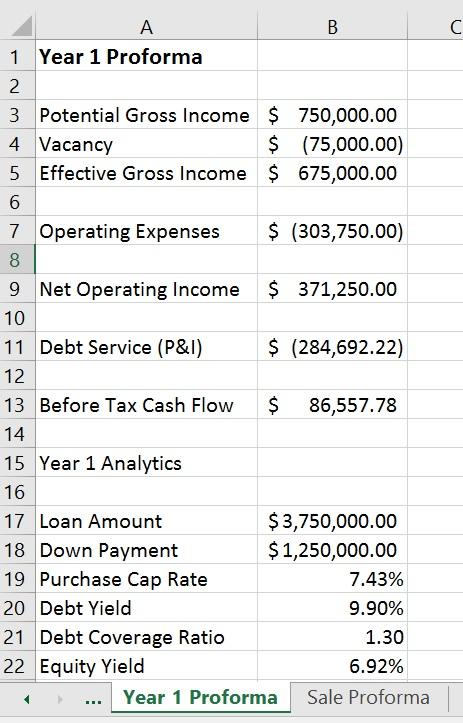
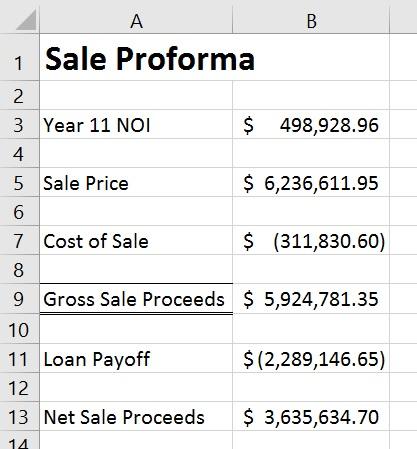
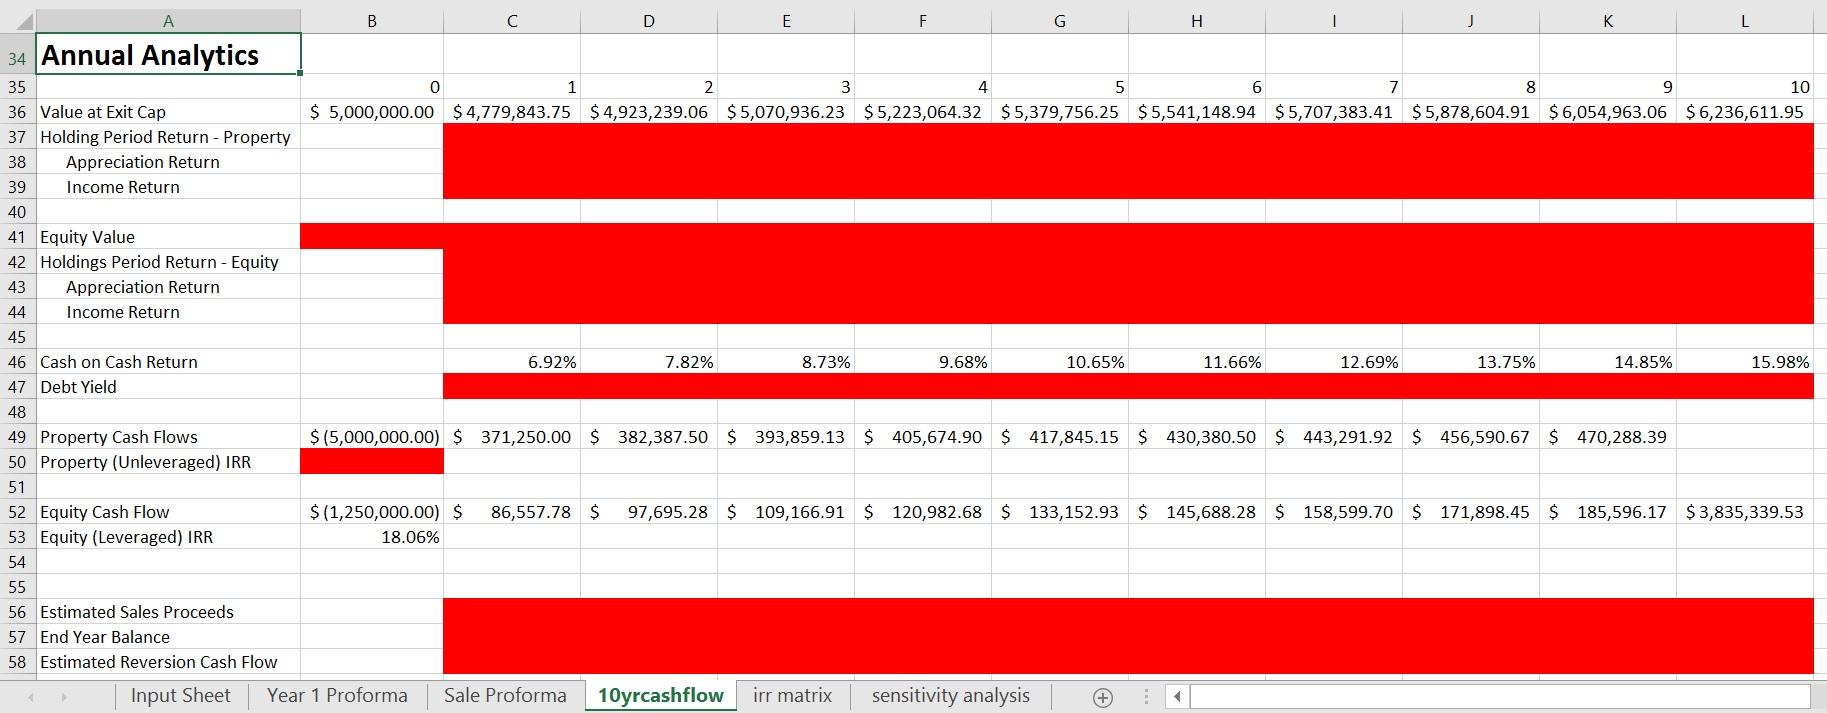
$ 5,000,000.00 $ 750,000.00 10% 45% 75% 4.50% 3 Property Info 4 5 Purchase Price 6 7 Potential Gross Income 8 9 Vacancy Percentage 10 11 Operating Expenses (%) 12 13 Loan Info 14 15 Loan to Value Ratio 16 17 Annual Interest Rate 18 19 Term (months) 20 21 Payoff Month 22 23 Other Assumptions 24 25 Annual Rent Growth 26 27 Annual Expense Growth 28 29 Exit Cap Rate 30 31 Cost of Sale 32 33 Cap Rate Sensitivity Interval 240 120 3% 3% 8.00% 5% 1.00% 21 Input Sheet Year 1 Proformas Ready B C A B 1 Year 1 Proforma 2 3 Potential Gross Income $ 750,000.00 4 Vacancy $ (75,000.00) 5 Effective Gross Income $ 675,000.00 6 7 Operating Expenses $ (303,750.00) 8 9 Net Operating Income $ 371,250.00 10 11 Debt Service (P&I) $ (284,692.22) 12 13 Before Tax Cash Flow 86,557.78 14 15 Year 1 Analytics 16 17 Loan Amount $3,750,000.00 18 Down Payment $1,250,000.00 19 Purchase Cap Rate 7.43% 20 Debt Yield 9.90% 21 Debt Coverage Ratio 1.30 22 Equity Yield 6.92% Year 1 Proforma Sale Proforma $ A B 1 Sale Proforma 2 3 Year 11 NOI $ 498,928.96 4 5 Sale Price $ 6,236,611.95 6 7 Cost of Sale $ (311,830.60) 8 9 Gross Sale Proceeds $ 5,924,781.35 10 11 Loan Payoff $(2,289,146.65) 12 13 Net Sale Proceeds $ 3,635,634.70 14 B D E F G H K 4 9 0 1 2 3 5 6 7 8 10 $ 5,000,000.00 $4,779,843.75 $ 4,923,239.06 $5,070,936.23 $5,223,064.32 $5,379,756.25 $5,541,148.94 $ 5,707,383.41 $5,878,604.91 $6,054,963.06 $ 6,236,611.95 34 Annual Analytics 35 36 Value at Exit Cap 37 Holding Period Return - Property 38 Appreciation Return 39 Income Return 40 41 Equity Value 42 Holdings Period Return - Equity 43 Appreciation Return 44 Income Return 45 46 Cash on Cash Return 47 Debt Yield 48 49 Property Cash Flows 50 Property (Unleveraged) IRR 51 52 Equity Cash Flow 53 Equity (Leveraged) IRR 54 55 56 Estimated Sales Proceeds 57 End Year Balance 58 Estimated Reversion Cash Flow 6.92% 7.82% 8.73% 9.68% 10.65% 11.66% 12.69% 13.75% 14.85% 15.98% $ (5,000,000.00) $ 371,250.00 $ 382,387.50 $ 393,859.13 $ 405,674.90 $ 417,845.15 $ 430,380.50 $ 443,291.92 $ 456,590.67 $ 470,288.39 86,557.78 $ 97,695.28 $ 109,166.91 $ 120,982.68 $ 133,152.93 $ 145,688.28 $ 158,599.70 $ 171,898.45 $ 185,596.17 $3,835,339.53 $(1,250,000.00) $ 18.06% Input Sheet Year 1 Proforma Sale Proforma 10yrcashflow irr matrix sensitivity analysis $ 5,000,000.00 $ 750,000.00 10% 45% 75% 4.50% 3 Property Info 4 5 Purchase Price 6 7 Potential Gross Income 8 9 Vacancy Percentage 10 11 Operating Expenses (%) 12 13 Loan Info 14 15 Loan to Value Ratio 16 17 Annual Interest Rate 18 19 Term (months) 20 21 Payoff Month 22 23 Other Assumptions 24 25 Annual Rent Growth 26 27 Annual Expense Growth 28 29 Exit Cap Rate 30 31 Cost of Sale 32 33 Cap Rate Sensitivity Interval 240 120 3% 3% 8.00% 5% 1.00% 21 Input Sheet Year 1 Proformas Ready B C A B 1 Year 1 Proforma 2 3 Potential Gross Income $ 750,000.00 4 Vacancy $ (75,000.00) 5 Effective Gross Income $ 675,000.00 6 7 Operating Expenses $ (303,750.00) 8 9 Net Operating Income $ 371,250.00 10 11 Debt Service (P&I) $ (284,692.22) 12 13 Before Tax Cash Flow 86,557.78 14 15 Year 1 Analytics 16 17 Loan Amount $3,750,000.00 18 Down Payment $1,250,000.00 19 Purchase Cap Rate 7.43% 20 Debt Yield 9.90% 21 Debt Coverage Ratio 1.30 22 Equity Yield 6.92% Year 1 Proforma Sale Proforma $ A B 1 Sale Proforma 2 3 Year 11 NOI $ 498,928.96 4 5 Sale Price $ 6,236,611.95 6 7 Cost of Sale $ (311,830.60) 8 9 Gross Sale Proceeds $ 5,924,781.35 10 11 Loan Payoff $(2,289,146.65) 12 13 Net Sale Proceeds $ 3,635,634.70 14 B D E F G H K 4 9 0 1 2 3 5 6 7 8 10 $ 5,000,000.00 $4,779,843.75 $ 4,923,239.06 $5,070,936.23 $5,223,064.32 $5,379,756.25 $5,541,148.94 $ 5,707,383.41 $5,878,604.91 $6,054,963.06 $ 6,236,611.95 34 Annual Analytics 35 36 Value at Exit Cap 37 Holding Period Return - Property 38 Appreciation Return 39 Income Return 40 41 Equity Value 42 Holdings Period Return - Equity 43 Appreciation Return 44 Income Return 45 46 Cash on Cash Return 47 Debt Yield 48 49 Property Cash Flows 50 Property (Unleveraged) IRR 51 52 Equity Cash Flow 53 Equity (Leveraged) IRR 54 55 56 Estimated Sales Proceeds 57 End Year Balance 58 Estimated Reversion Cash Flow 6.92% 7.82% 8.73% 9.68% 10.65% 11.66% 12.69% 13.75% 14.85% 15.98% $ (5,000,000.00) $ 371,250.00 $ 382,387.50 $ 393,859.13 $ 405,674.90 $ 417,845.15 $ 430,380.50 $ 443,291.92 $ 456,590.67 $ 470,288.39 86,557.78 $ 97,695.28 $ 109,166.91 $ 120,982.68 $ 133,152.93 $ 145,688.28 $ 158,599.70 $ 171,898.45 $ 185,596.17 $3,835,339.53 $(1,250,000.00) $ 18.06% Input Sheet Year 1 Proforma Sale Proforma 10yrcashflow irr matrix sensitivity analysisStep by Step Solution
There are 3 Steps involved in it
Step: 1

Get Instant Access to Expert-Tailored Solutions
See step-by-step solutions with expert insights and AI powered tools for academic success
Step: 2

Step: 3
Ace Your Homework with AI
Get the answers you need in no time with our AI-driven, step-by-step assistance
Get Started
Financial Management Principles and Application
Authors: Arthur J. Keown, J. William Petty, David F. Scott, Jr.
10th edition
536514119, 536514110, 978-0536514110