Question
Hello, I just need help getting a written answer to this question with these two sources. Please I really need your help, it's for my
Hello, I just need help getting a written answer to this question with these two sources. Please I really need your help, it's for my assessment and I have 4 other questions to finish off but need help with this one. If you can do it for me to re-write in my own words using your expert skills it will mean soooo much I promise.
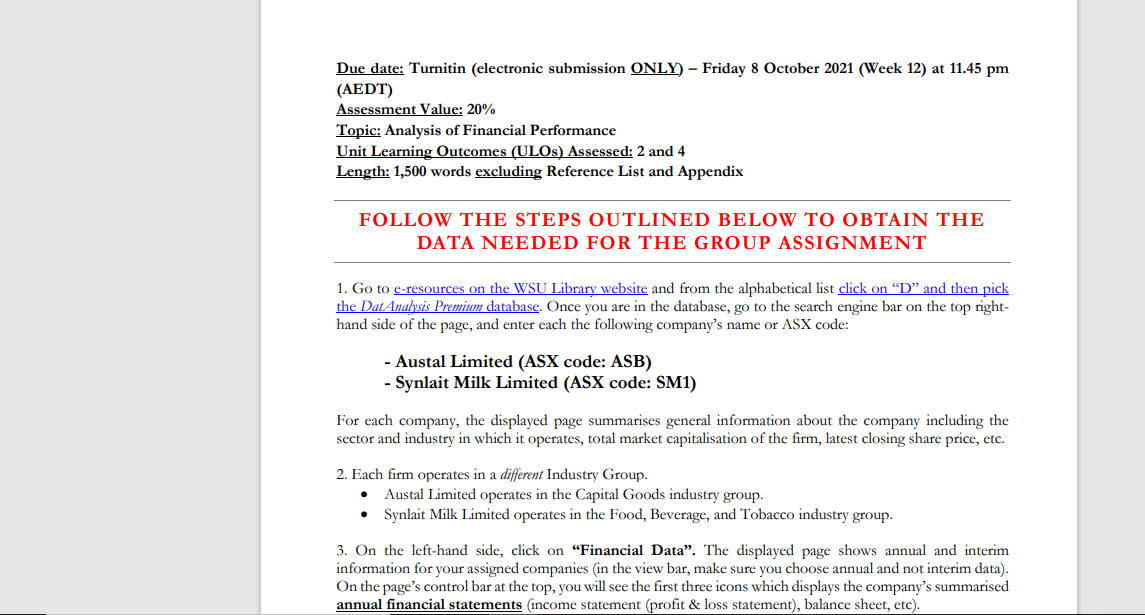
QUESTION 4:
Analyse the profitability of invested capital (assets) for each of the two companies in 2020 as compared to 2019.
Based on your calculations, explain the main reason(s) for the change in the profitability for each company over
the two years. Note: ensure that you analyse in this question, not just describe the ratio values.
Due date: Turnitin (electronic submission ONLY) - Friday 8 October 2021 (Week 12) at 11.45 pm (AEDT) Assessment Value: 20% Topic: Analysis of Financial Performance Unit Learning Outcomes (ULOs) Assessed: 2 and 4 Length: 1,500 words excluding Reference List and Appendix FOLLOW THE STEPS OUTLINED BELOW TO OBTAIN THE DATA NEEDED FOR THE GROUP ASSIGNMENT 1. Go to e-resources on the WSU Library website and from the alphabetical list click on "D" and then pick the Dat Analysis Premium database. Once you are in the database, go to the search engine bar on the top right- hand side of the page, and enter each the following company's name or ASX code: - Austal Limited (ASX code: ASB) - Synlait Milk Limited (ASX code: SM1) For each company, the displayed page summarises general information about the company including the sector and industry in which it operates, total market capitalisation of the firm, latest closing share price, etc. 2. Each firm operates in a different Industry Group. Austal Limited operates in the Capital Goods industry group. . Synlait Milk Limited operates in the Food, Beverage, and Tobacco industry group. 3. On the left-hand side, click on "Financial Data". The displayed page shows annual and interim information for your assigned companies (in the view bar, make sure you choose annual and not interim data). On the page's control bar at the top, you will see the first three icons which displays the company's summarised annual financial statements (income statement (profit & loss statement), balance sheet, etc)Step by Step Solution
There are 3 Steps involved in it
Step: 1
Get Instant Access to Expert-Tailored Solutions
See step-by-step solutions with expert insights and AI powered tools for academic success
Step: 2
Step: 3
Ace Your Homework with AI
Get the answers you need in no time with our AI-driven, step-by-step assistance
Get Started