Hello i need help answering this question, I have attached part one, which I have ddid and figured out. After looking at part one please help me answer part two with the break downs. Part two is the second photo. I have copied and pasted All of the instructions from Both Excel sheets. If any additional information is needed, please be specific about what information is needed.
Part One:
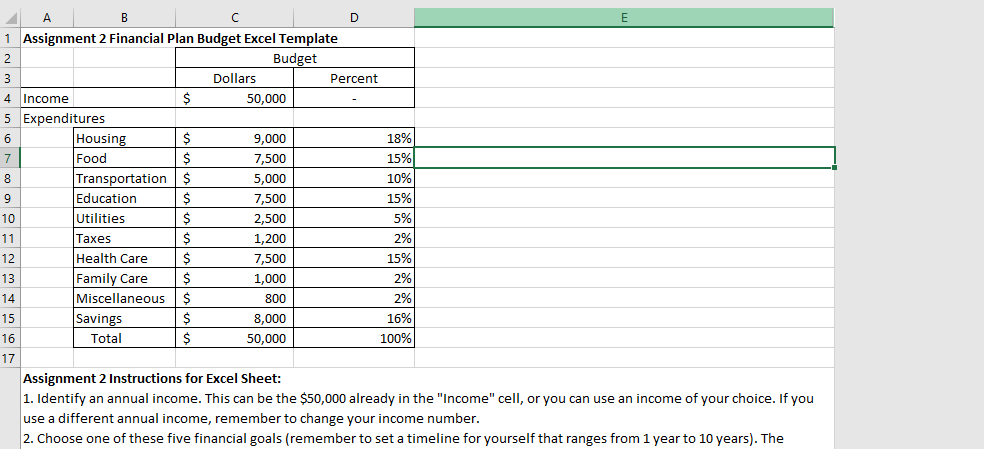
Assignment 2 Instructions for Excel Sheet: 1. Identify an annual income. This can be the $50,000 already in the "Income" cell, or you can use an income of your choice. If you use a different annual income, remember to change your income number.
2. Choose one of these five financial goals (remember to set a timeline for yourself that ranges from 1 year to 10 years). The number you put in the "Savings" cell of the budget table should be the cost of the goal you are saving for divided by the number of years you plan to be saving for it. a. Create an emergency fund of $1,000. b. Save for a vacation that will cost $2,000. c. Save to buy a $15,000 vehicle. d. Save for a down payment of $40,000 to buy a house. e. Save $50,000 for education (personal, child, family, etc.).
3. Choose one of these three housing options. Put the dollar number in the budget table above for "Housing." a. Rent a house. Cost is $15,000 per year. b. Rent an apartment. Cost is $12,000 per year. c. Rent a room only. Cost is $9,000 per year.
4. Fill in dollar values for the rest of your expenditures. This can be based on either a hypothetical ideal or what you might typically spend on these categories.
5. Use formulas to calculate the sum for your "Total" cell in the "Dollars" column and to fill in the "Percent" column.
6. Check to make sure your "Total" dollars is equal to the annual income you chose and that your "Total" percent is 100%.
***The instructions for part two and photo are below:
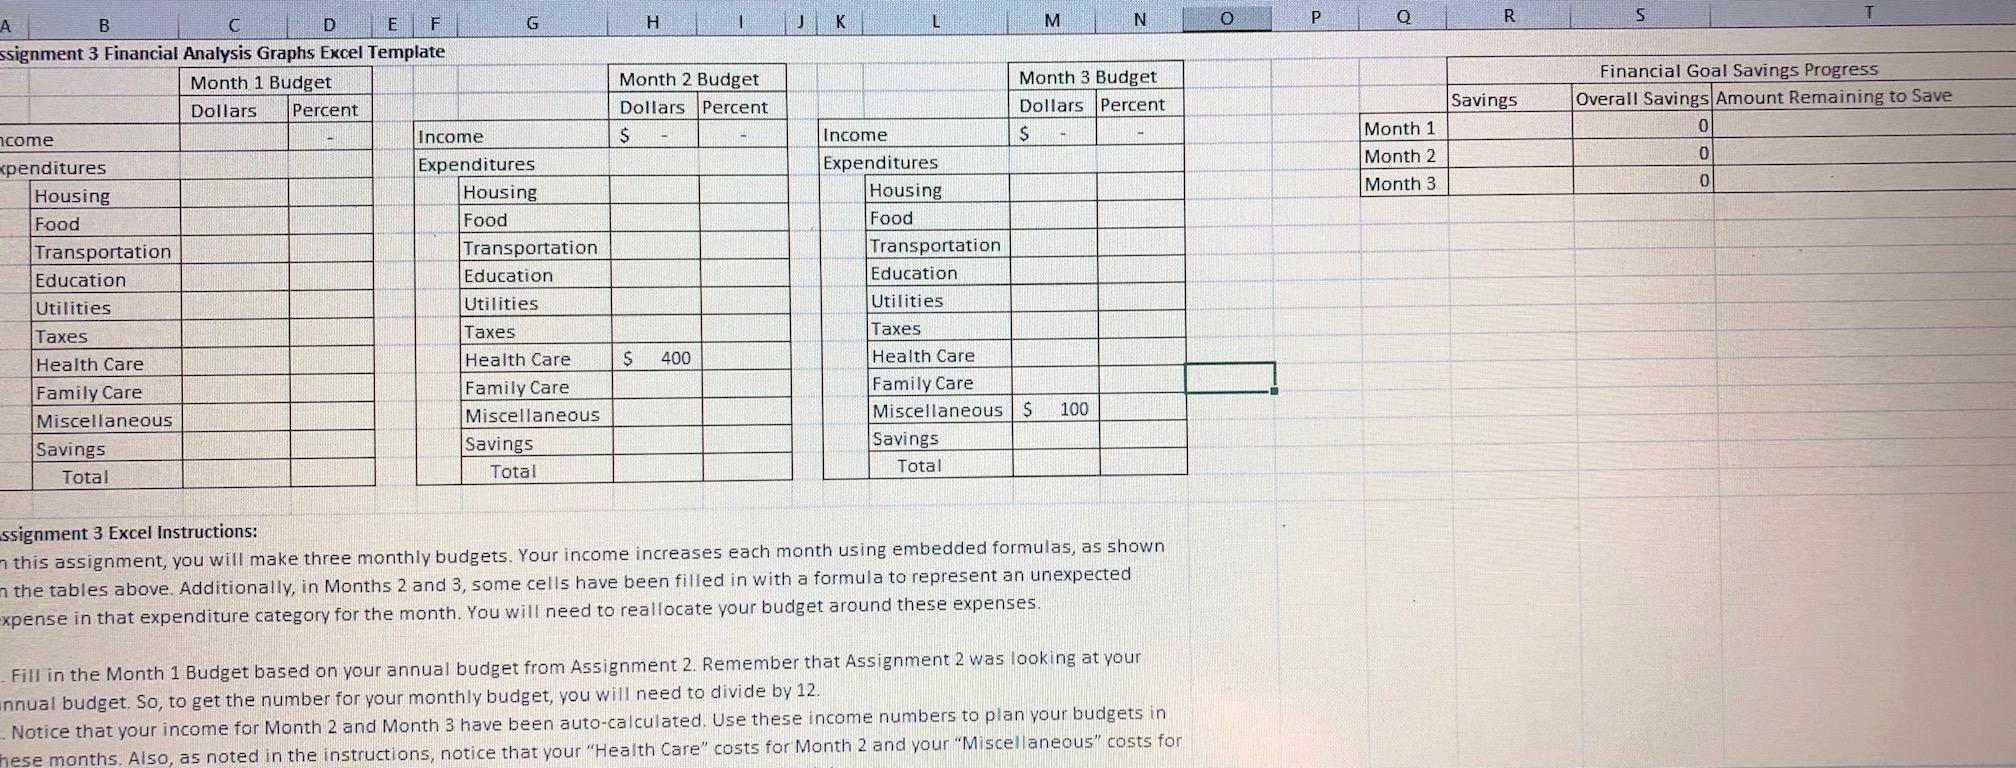
The monthly incomes for part 2 & 3 are already auto-calculated. Along with the Health Care costs for Month 2 and your Miscellaneous costs for Month 3.
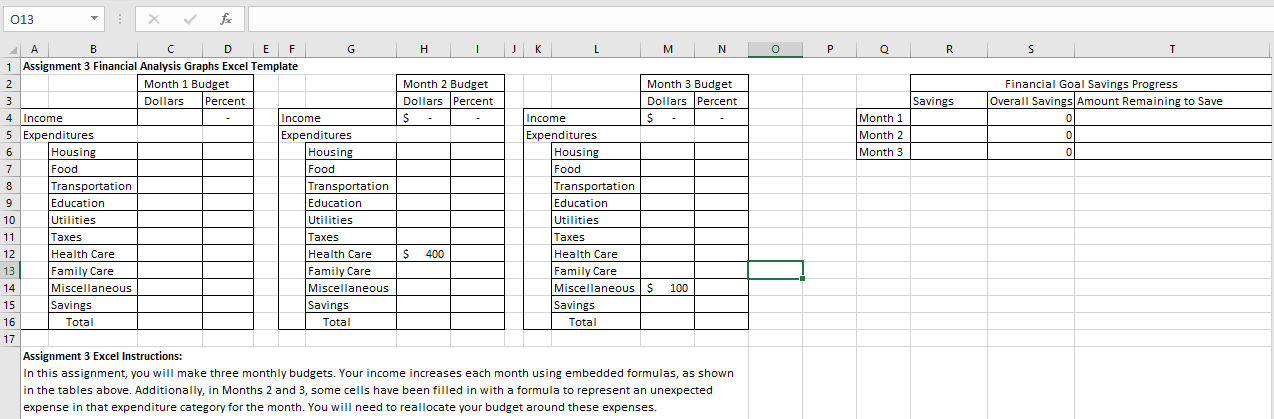
Assignment 3 Excel Instructions: In this assignment, you will make three monthly budgets. Your income increases each month using embedded formulas, as shown in the tables above. Additionally, in Months 2 and 3, some cells have been filled in with a formula to represent an unexpected expense in that expenditure category for the month. You will need to reallocate your budget around these expenses.
1. Fill in the Month 1 Budget based on your annual budget from Assignment 2. Remember that Assignment 2 was looking at your annual budget. So, to get the number for your monthly budget, you will need to divide by 12.
2. Notice that your income for Month 2 and Month 3 have been auto-calculated. Use these income numbers to plan your budgets in these months. Also, as noted in the instructions, notice that your Health Care costs for Month 2 and your Miscellaneous costs for Month 3 have auto-calculated. Do not change these numbers. You will need to plan around them.
3. For Month 2 and Month 3, fill in the cells for each category for how you are choosing to allocate your income in each of those months.
4. Use formulas to calculate the sum for your total in the Dollars columns, and fill in the Percent columns for each monthly budget.
5. Now produce a graphic for each of these three budgets to show the spending allocation. You could use a pie chart, bar chart, or other graphic from Excel. You will end up with three graphics, one for each month. Each graphic should show how you have allocated your income among the various categories.
6. Complete the Financial Goal Savings Progress table by entering in the Savings amount from each of your three monthly budgets. Use a formula to calculate how much you have left to save using the dollar amount of your chosen savings goal from Assignment 2.
7. Create a graphic that shows your progress toward your savings goal based on the information you input into the Financial Goal Savings Progress table. Select the type of graphic that you think would best illustrate your progress.
8. Put the graphics in the space below on this spreadsheet.
I've added two photos of part two. They are the same, I just wanted you t be abke to get a better view
Part Two Photo:
B C D E 1 Assignment 2 Financial Plan Budget Excel Template 2 2. Budget 3 Dollars Percent 4 Income $ 50,000 5 Expenditures 6 Housing $ 9,000 18% 7 Food $ 7,500 15% 8 Transportation $ 5,000 10% 9 Education $ 7,500 15% 10 Utilities $ 2,500 5% 11 Taxes $ 1,200 2% 12 Health Care $ 7,500 15% 13 Family Care $ 1,000 2% 14 Miscellaneous $ 800 2% 15 Savings $ 8,000 16% 16 Total $ 50,000 100% 17 Assignment 2 Instructions for Excel Sheet: 1. Identify an annual income. This can be the $50,000 already in the "Income" cell, or you can use an income of your choice. If you use a different annual income, remember to change your income number. 2. Choose one of these five financial goals (remember to set a timeline for yourself that ranges from 1 year to 10 years). The H L N M K T R P 0 5 Q Month 2 Budget Dollars Percent $ Savings Financial Goal Savings Progress Overall Savings Amount Remaining to Save 0 0 Month 1 Month 2 Month 3 0 B D E F G ssignment 3 Financial Analysis Graphs Excel Template Month 1 Budget Dollars Percent ncome Income xpenditures Expenditures Housing Housing Food Food Transportation Transportation Education Education Utilities Utilities Taxes Taxes Health Care Health Care Family Care Family Care Miscellaneous Miscellaneous Savings Savings Total Total Month 3 Budget Dollars Percent Income S Expenditures Housing Food Transportation Education Utilities Taxes Health Care Family Care Miscellaneous S 100 Savings Total $ 400 ssignment 3 Excel Instructions: 7 this assignment, you will make three monthly budgets. Your income increases each month using embedded formulas, as shown n the tables above. Additionally, in Months 2 and 3, some cells have been filled in with a formula to represent an unexpected expense in that expenditure category for the month. You will need to reallocate your budget around these expenses. Fill in the Month 1 Budget based on your annual budget from Assignment 2. Remember that Assignment 2 was looking at your unnual budget. So, to get the number for your monthly budget, you will need to divide by 12. - Notice that your income for Month 2 and Month 3 have been auto-calculated. Use these income numbers to plan your budgets in These months. Also, as noted in the instructions, notice that your "Health Care" costs for Month 2 and your "Miscellaneous" costs for 013 fi o R S Savings Financial Goal Savings Progress Overall Savings Amount Remaining to Save 0 Month 1 Month 2 Month 3 0 0 4A B E F G H 1 J K L M N 1 Assignment 3 Financial Analysis Graphs Excel Template 2 Month 1 Budget Month 2 Budget Month 3 Budget 3 Dollars Percent Dollars Percent Dollars Percent 4 Income Income $ Income $ 5 Expenditures Expenditures Expenditures 6 Housing Housing Housing 7 Food Food Food 8 Transportation Transportation Transportation 9 Education Education Education 10 Utilities Utilities Utilities 11 Taxes Taxes Taxes 12 Health Care Health Care $ 400 Health Care 13 Family Care Family Care Family Care 14 Miscellaneous Miscellaneous Miscellaneous $ 100 15 Savings Savings Savings 16 Total Total Total 17 Assignment 3 Excel Instructions: In this assignment, you will make three monthly budgets. Your income increases each month using embedded formulas, as shown in the tables above. Additionally, in Months 2 and 3, some cells have been filled in with a formula to represent an unexpected expense in that expenditure category for the month. You will need to reallocate your budget around these expenses. B C D E 1 Assignment 2 Financial Plan Budget Excel Template 2 2. Budget 3 Dollars Percent 4 Income $ 50,000 5 Expenditures 6 Housing $ 9,000 18% 7 Food $ 7,500 15% 8 Transportation $ 5,000 10% 9 Education $ 7,500 15% 10 Utilities $ 2,500 5% 11 Taxes $ 1,200 2% 12 Health Care $ 7,500 15% 13 Family Care $ 1,000 2% 14 Miscellaneous $ 800 2% 15 Savings $ 8,000 16% 16 Total $ 50,000 100% 17 Assignment 2 Instructions for Excel Sheet: 1. Identify an annual income. This can be the $50,000 already in the "Income" cell, or you can use an income of your choice. If you use a different annual income, remember to change your income number. 2. Choose one of these five financial goals (remember to set a timeline for yourself that ranges from 1 year to 10 years). The H L N M K T R P 0 5 Q Month 2 Budget Dollars Percent $ Savings Financial Goal Savings Progress Overall Savings Amount Remaining to Save 0 0 Month 1 Month 2 Month 3 0 B D E F G ssignment 3 Financial Analysis Graphs Excel Template Month 1 Budget Dollars Percent ncome Income xpenditures Expenditures Housing Housing Food Food Transportation Transportation Education Education Utilities Utilities Taxes Taxes Health Care Health Care Family Care Family Care Miscellaneous Miscellaneous Savings Savings Total Total Month 3 Budget Dollars Percent Income S Expenditures Housing Food Transportation Education Utilities Taxes Health Care Family Care Miscellaneous S 100 Savings Total $ 400 ssignment 3 Excel Instructions: 7 this assignment, you will make three monthly budgets. Your income increases each month using embedded formulas, as shown n the tables above. Additionally, in Months 2 and 3, some cells have been filled in with a formula to represent an unexpected expense in that expenditure category for the month. You will need to reallocate your budget around these expenses. Fill in the Month 1 Budget based on your annual budget from Assignment 2. Remember that Assignment 2 was looking at your unnual budget. So, to get the number for your monthly budget, you will need to divide by 12. - Notice that your income for Month 2 and Month 3 have been auto-calculated. Use these income numbers to plan your budgets in These months. Also, as noted in the instructions, notice that your "Health Care" costs for Month 2 and your "Miscellaneous" costs for 013 fi o R S Savings Financial Goal Savings Progress Overall Savings Amount Remaining to Save 0 Month 1 Month 2 Month 3 0 0 4A B E F G H 1 J K L M N 1 Assignment 3 Financial Analysis Graphs Excel Template 2 Month 1 Budget Month 2 Budget Month 3 Budget 3 Dollars Percent Dollars Percent Dollars Percent 4 Income Income $ Income $ 5 Expenditures Expenditures Expenditures 6 Housing Housing Housing 7 Food Food Food 8 Transportation Transportation Transportation 9 Education Education Education 10 Utilities Utilities Utilities 11 Taxes Taxes Taxes 12 Health Care Health Care $ 400 Health Care 13 Family Care Family Care Family Care 14 Miscellaneous Miscellaneous Miscellaneous $ 100 15 Savings Savings Savings 16 Total Total Total 17 Assignment 3 Excel Instructions: In this assignment, you will make three monthly budgets. Your income increases each month using embedded formulas, as shown in the tables above. Additionally, in Months 2 and 3, some cells have been filled in with a formula to represent an unexpected expense in that expenditure category for the month. You will need to reallocate your budget around these expenses