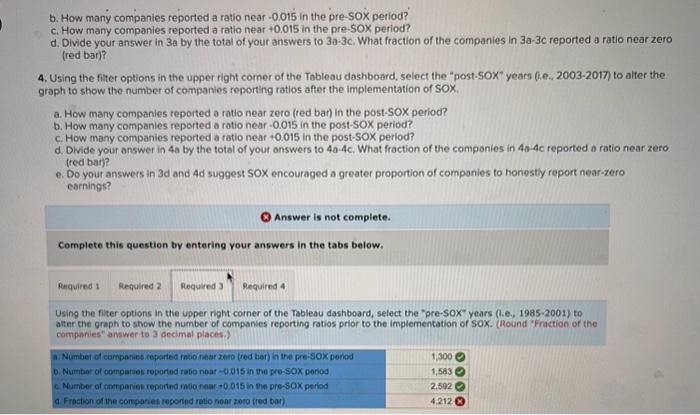
Hello, I need help finding 3d and 4d. For 3d, it says "Divide your answer in 3a by the total of your answers to 3a-3c. What fraction of the companies in 3a-3c reported a ratio near zero (red bar)?" I did 1300/(1300+1583+2592) and got 4.2115 (4.212 rounded) but it's not right 
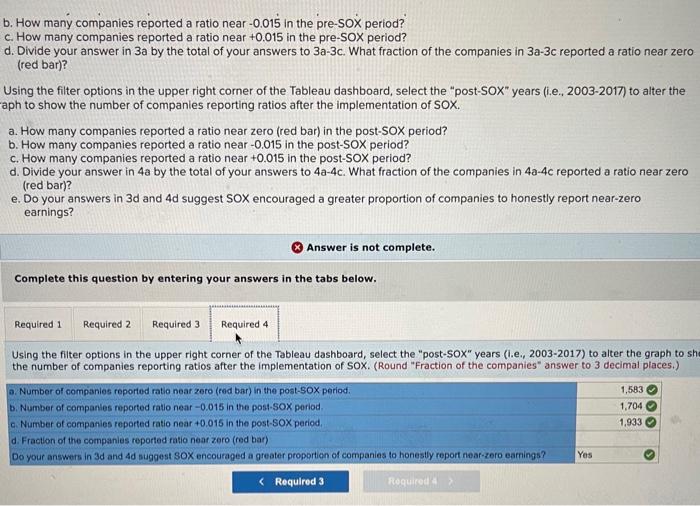
b. How many companies reported a ratio near -0.015 in the pre-sox period? c. How many companies reported a ratio near +0.015 in the pre.SOX period? d. Divide your answer in 3a by the total of your answers to 3a3c. What fraction of the companies in 3a3c reported a ratio near zero (red bar)? 4. Using the fiter options in the upper right corner of the Tableau dashboard, select the "post-SOX" years (i.e. 2003-2017) to alter the graph to show the number of companies reporting ratios after the implementation of SOX. a. How many companies reported a ratio near zero (red bar) in the post-SOX period? b. How many companies reported a rotio near -0.015 in the post-SOX period? c. How many companies reported a rationear +0.015 in the post-SOX period? d. Divide your answer in 4a by the total of your answers to 4a4c. What fraction of the componies in 40.4c reported a ratio near zero (red bar)? e. Do your answers in 3d and 4d suggest SOX encouraged a greater proportion of companies to honesty report near-zero earnings? Q Answer is not complete. Complete this question by entering your answers in the tabs below. Using the fiter options in the upper night corner of the Tableau dashboard, select the "pre-sox" years (0.e., 1985-2001) to atter the graph to show the number of companies reporting ratios prior to the implementation of SoX. (Round 'Fraction of the companies" answer to 3 decimal places.) b. How many companies reported a ratio near -0.015 in the pre-soX period? c. How many companies reported a ratio near +0.015 in the pre-SOX period? d. Divide your answer in 3 a by the total of your answers to 3a-3c. What fraction of the companies in 3a3c reported a ratio near zero (red bar)? Using the filter options in the upper right corner of the Tableau dashboard, select the "post-SOX" years (i.e., 2003-2017) to alter the aph to show the number of companies reporting ratios after the implementation of SOX. a. How many companies reported a ratio near zero (red bar) in the post-SOX period? b. How many companies reported a ratio near -0.015 in the post-SOX period? c. How many companies reported a ratio near +0.015 in the post-SOX period? d. Divide your answer in 4a by the total of your answers to 4a4c. What fraction of the companies in 4a4c reported a ratio near zero (red bar)? e. Do your answers in 3d and 4d suggest SOX encouraged a greater proportion of companies to honestly report near-zero earnings? Answer is not complete. Complete this question by entering your answers in the tabs below. Using the filter options in the upper right corner of the Tableau dashboard, select the "post-SOX" years (1.e., 2003-2017) to alter the graph to st the number of companies reporting ratios after the implementation of SOX. (Round "Fraction of the companies" answer to 3 decimal places.) b. How many companies reported a ratio near -0.015 in the pre-sox period? c. How many companies reported a ratio near +0.015 in the pre.SOX period? d. Divide your answer in 3a by the total of your answers to 3a3c. What fraction of the companies in 3a3c reported a ratio near zero (red bar)? 4. Using the fiter options in the upper right corner of the Tableau dashboard, select the "post-SOX" years (i.e. 2003-2017) to alter the graph to show the number of companies reporting ratios after the implementation of SOX. a. How many companies reported a ratio near zero (red bar) in the post-SOX period? b. How many companies reported a rotio near -0.015 in the post-SOX period? c. How many companies reported a rationear +0.015 in the post-SOX period? d. Divide your answer in 4a by the total of your answers to 4a4c. What fraction of the componies in 40.4c reported a ratio near zero (red bar)? e. Do your answers in 3d and 4d suggest SOX encouraged a greater proportion of companies to honesty report near-zero earnings? Q Answer is not complete. Complete this question by entering your answers in the tabs below. Using the fiter options in the upper night corner of the Tableau dashboard, select the "pre-sox" years (0.e., 1985-2001) to atter the graph to show the number of companies reporting ratios prior to the implementation of SoX. (Round 'Fraction of the companies" answer to 3 decimal places.) b. How many companies reported a ratio near -0.015 in the pre-soX period? c. How many companies reported a ratio near +0.015 in the pre-SOX period? d. Divide your answer in 3 a by the total of your answers to 3a-3c. What fraction of the companies in 3a3c reported a ratio near zero (red bar)? Using the filter options in the upper right corner of the Tableau dashboard, select the "post-SOX" years (i.e., 2003-2017) to alter the aph to show the number of companies reporting ratios after the implementation of SOX. a. How many companies reported a ratio near zero (red bar) in the post-SOX period? b. How many companies reported a ratio near -0.015 in the post-SOX period? c. How many companies reported a ratio near +0.015 in the post-SOX period? d. Divide your answer in 4a by the total of your answers to 4a4c. What fraction of the companies in 4a4c reported a ratio near zero (red bar)? e. Do your answers in 3d and 4d suggest SOX encouraged a greater proportion of companies to honestly report near-zero earnings? Answer is not complete. Complete this question by entering your answers in the tabs below. Using the filter options in the upper right corner of the Tableau dashboard, select the "post-SOX" years (1.e., 2003-2017) to alter the graph to st the number of companies reporting ratios after the implementation of SOX. (Round "Fraction of the companies" answer to 3 decimal places.)


