

Answered step by step
Verified Expert Solution
Question
1 Approved Answer
hello ! i need help with Formula for cell c20 to cell c29! i tried exact formula on instructions but i don't quite understanding! 196
hello ! i need help with Formula for cell c20 to cell c29! i tried exact formula on instructions but i don't quite understanding! 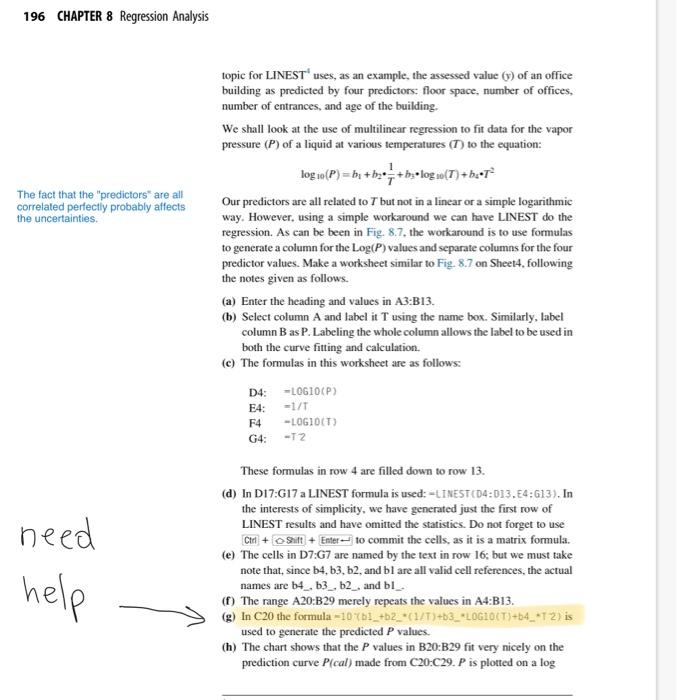
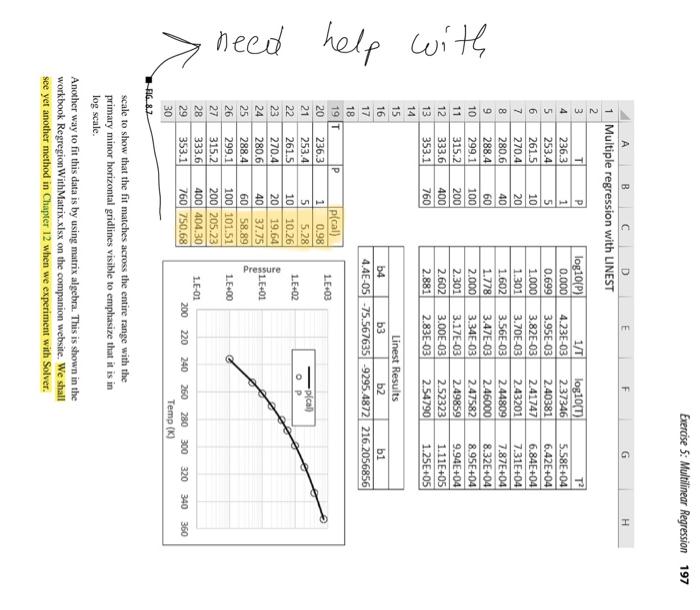
196 CHAPTER 8 Regression Analysis topic for LINEST 4 uses, as an example, the assessed value ( y ) of an office building as predicted by four predictors: floor space, number of offices, number of entrances, and age of the building. We shall look at the use of multilinear regression to fit data for the vapor pressure (P) of a liquid at various temperatures (T) to the equation: log10(P)=b1+b2T1+b3log10(T)+b4T2 The fact that the "predictors" are all Our predictors are all related to T but not in a linear or a simple logarithmic correlated perfectly probably affects way. However, using a simple workaround we can have LINEST do the regression. As can be been in Fig. 8.7, the workaround is to use formulas to generate a column for the log(P) values and separate columns for the four predictor values. Make a worksheet similar to Fig. 8.7 on Sheet4, following the notes given as follows. (a) Enter the heading and values in A3:B13. (b) Select column A and label it T using the name box. Similarly, label column B as P. Labeling the whole column allows the label to be used in both the curve fitting and calculation. (c) The formulas in this worksheet are as follows: D4:E4:F4G4:10610(P)=1/T10610(T)12 These formulas in row 4 are filled down to row 13. (d) In D17:G17 a LINEST formula is used: - LINEST (D4:D13,E4;G13). In the interests of simplicity, we have generated just the first row of LINEST results and have omitted the statistics. Do not forget to use Ctat] +S ift + Entef to commit the cells, as it is a matrix formula. (e) The cells in D7:G7 are named by the text in row 16; but we must take note that, since b4,b3,b2, and b1 are all valid cell references, the actual names are b4_, b3_, b2_, and b1 (f) The range A20:B29 merely repeats the values in A4:B13. used to generate the predicted P values. (h) The chart shows that the P values in B20:B29 fit very nicely on the prediction curve P( call ) made from C20C29. P is plotted on a log necd help with 196 CHAPTER 8 Regression Analysis topic for LINEST 4 uses, as an example, the assessed value ( y ) of an office building as predicted by four predictors: floor space, number of offices, number of entrances, and age of the building. We shall look at the use of multilinear regression to fit data for the vapor pressure (P) of a liquid at various temperatures (T) to the equation: log10(P)=b1+b2T1+b3log10(T)+b4T2 The fact that the "predictors" are all Our predictors are all related to T but not in a linear or a simple logarithmic correlated perfectly probably affects way. However, using a simple workaround we can have LINEST do the regression. As can be been in Fig. 8.7, the workaround is to use formulas to generate a column for the log(P) values and separate columns for the four predictor values. Make a worksheet similar to Fig. 8.7 on Sheet4, following the notes given as follows. (a) Enter the heading and values in A3:B13. (b) Select column A and label it T using the name box. Similarly, label column B as P. Labeling the whole column allows the label to be used in both the curve fitting and calculation. (c) The formulas in this worksheet are as follows: D4:E4:F4G4:10610(P)=1/T10610(T)12 These formulas in row 4 are filled down to row 13. (d) In D17:G17 a LINEST formula is used: - LINEST (D4:D13,E4;G13). In the interests of simplicity, we have generated just the first row of LINEST results and have omitted the statistics. Do not forget to use Ctat] +S ift + Entef to commit the cells, as it is a matrix formula. (e) The cells in D7:G7 are named by the text in row 16; but we must take note that, since b4,b3,b2, and b1 are all valid cell references, the actual names are b4_, b3_, b2_, and b1 (f) The range A20:B29 merely repeats the values in A4:B13. used to generate the predicted P values. (h) The chart shows that the P values in B20:B29 fit very nicely on the prediction curve P( call ) made from C20C29. P is plotted on a log necd help with Step by Step Solution
There are 3 Steps involved in it
Step: 1

Get Instant Access to Expert-Tailored Solutions
See step-by-step solutions with expert insights and AI powered tools for academic success
Step: 2

Step: 3
Ace Your Homework with AI
Get the answers you need in no time with our AI-driven, step-by-step assistance
Get Started
Statistical Reasoning for Everyday Life
Authors: Jeff Bennett, Bill Briggs, Mario F. Triola
4th edition
978-0321817747, 321817745, 978-0321890139, 321890132, 321817621, 978-0321817624