Hello, I need help with the following questions. All the question has to be done in excel. Please and thank you. All the data is
Hello, I need help with the following questions. All the question has to be done in excel. Please and thank you. All the data is with its questions so nothing should be missing
HW 2:
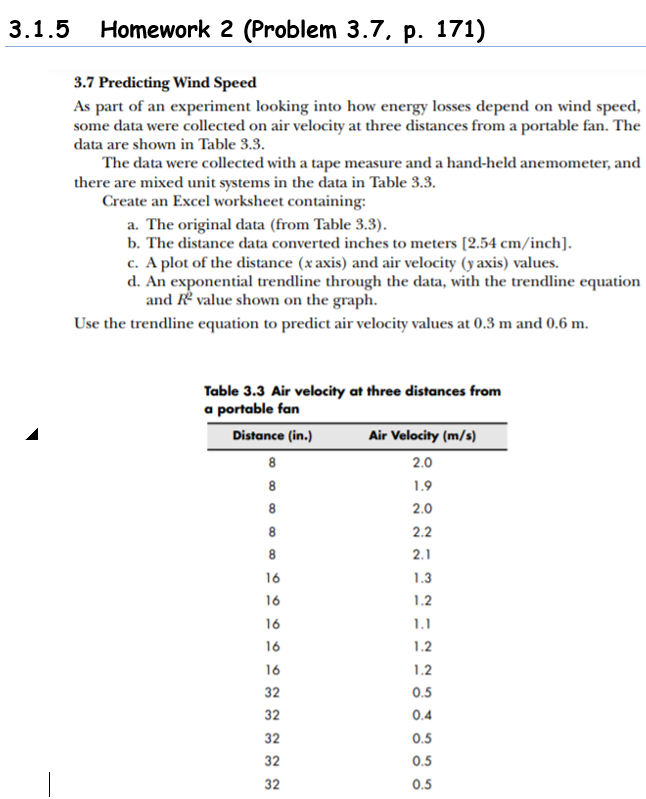
The data were collected with a tape measure and a hand-held anemometer, and there are mixed unit systems in the data in Table 3.3 . Create a Excel worksheet containing: a. The original data (from Table 3.3 ). b. The distance data converted inches to meters [2.54 cm/inch]. c. A plot of the distance ( x axis) and air velocity ( y axis) values. d. An exponential trendline through the data, with the trendline equation and R2 value shown on the graph. Use the trendline equation to predict air velocity values at 0.3 m and 0.6 m.
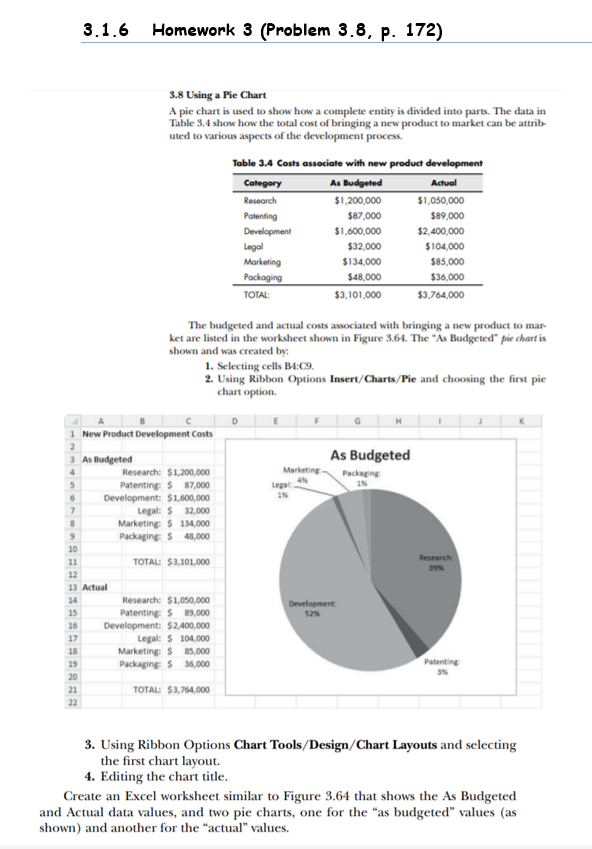
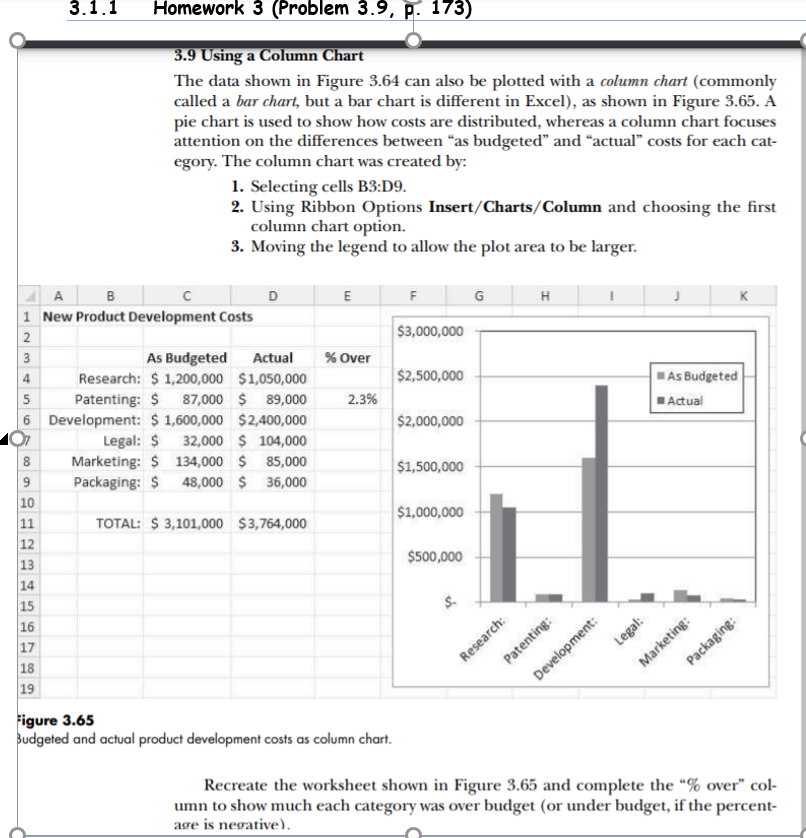
3.1.5 Homework 2 (Problem 3.7, p. 171) 3.7 Predicting Wind Speed As part of an experiment looking into how energy losses depend on wind speed, some data were collected on air velocity at three distances from a portable fan. The data are shown in Table 3.3. The data were collected with a tape measure and a hand-held anemometer, and there are mixed unit systems in the data in Table 3.3. Create an Excel worksheet containing: a. The original data (from Table 3.3). b. The distance data converted inches to meters [2.54 cm/inch]. c. A plot of the distance (x axis) and air velocity (y axis) values. d. An exponential trendline through the data, with the trendline equation and R- value shown on the graph. Use the trendline equation to predict air velocity values at 0.3 m and 0.6 m. Table 3.3 Air velocity at three distances from a portable fan Distance (in.) Air Velocity (m/s) 2.0 1.9 2.0 2.2 2.1 1.3 1.2 1.1 1.2 1.2 0.5 32 0.4 32 0.5 32 0.5 32 0.53.1.6 Homework 3 (Problem 3.8, p. 172) 3.8 Using a Pie Chart A pie chart is used to show how a complete entity is divided into parts. The data in Table 3.4 show how the total cost of bringing a new product to market can be attrib- uted to various aspects of the development process. Table 3.4 Costs associate with new product development Category As Budgeted Actual Research $1,200,000 $1,050,000 Patenting $87,000 $89,000 Development $1,600,000 $2,400,000 Legal $32,000 $104,000 Marketing $134,000 $85,000 Packaging $48,000 $36,000 TOTAL $3,101,000 $3,764,000 The budgeted and actual costs associated with bringing a new product to mar ket are listed in the worksheet shown in Figure 3.64. The "As Budgeted" pie chart is shown and was created by: 1. Selecting cells B4:09. 2. Using Ribbon Options Insert/Charts/Pie and choosing the first pie chart option. A C D H 1 New Product Development Costs 2 3 As Budgeted As Budgeted Research: $1,200,000 Marketing Packaging Patenting: $ 87,000 Legal: IN Development: $1,600,000 IN Legal: $ 32,000 Marketing: $ 134,000 9 Packaging: $ 48,000 10 11 TOTAL: $3,101,000 Research 12 13 Actual 14 Research: $1,050,000 Development 15 Patenting: $ 89,000 16 Development: $2,400,000 17 Legal: $ 104,000 18 Marketing: $ 85,000 19 Packaging: $ 36,000 Patenting 20 21 TOTAL: $3,764,000 22 3. Using Ribbon Options Chart Tools/Design/Chart Layouts and selecting the first chart layout. 4. Editing the chart title. Create an Excel worksheet similar to Figure 3.64 that shows the As Budgeted and Actual data values, and two pie charts, one for the "as budgeted" values (as shown) and another for the "actual" values.3.1.1 Homework 3 (Problem 3.9, p. 173) 3.9 Using a Column Chart The data shown in Figure 3.64 can also be plotted with a column chart (commonly called a bar chart, but a bar chart is different in Excel), as shown in Figure 3.65. A pie chart is used to show how costs are distributed, whereas a column chart focuses attention on the differences between "as budgeted" and "actual" costs for each cat- egory. The column chart was created by: 1. Selecting cells B3:D9. 2. Using Ribbon Options Insert/Charts/Column and choosing the first column chart option. 3. Moving the legend to allow the plot area to be larger. 4 A B C D E F G H 1 New Product Development Costs $3,000,000 As Budgeted Actual % Over Research: $ 1,200,000 $1,050,000 $2,500,000 As Budgeted Patenting: $ 87,000 89,000 2.3% Actual Development: $ 1,600,000 $2,400,000 $2,000,000 Legal: $ 32,000 $ 104,000 Marketing: $ 134,000 S 85,000 $1,500,000 Packaging: $ 48,000 S 36,000 10 $1,000,000 11 TOTAL: $ 3,101,000 $3,764,000 12 13 $500,000 14 15 S. 16 Legal: 17 Research: Patenting Development: Marketing: Packaging: 18 19 Figure 3.65 Budgeted and actual product development costs as column chart. Recreate the worksheet shown in Figure 3.65 and complete the "% over" col- umn to show much each category was over budget (or under budget, if the percent- age is negative)
Step by Step Solution
There are 3 Steps involved in it
Step: 1
Get Instant Access to Expert-Tailored Solutions
See step-by-step solutions with expert insights and AI powered tools for academic success
Step: 2
Step: 3
Ace Your Homework with AI
Get the answers you need in no time with our AI-driven, step-by-step assistance