Hello, I need help with this assignment. need to create a balance sheet, P & L, Statement of Cash Flows, and company specific metrics. I will upvote. thank you!
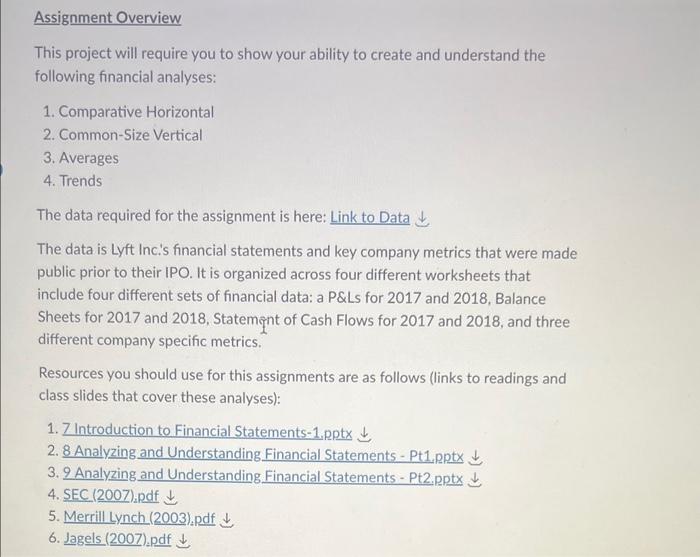
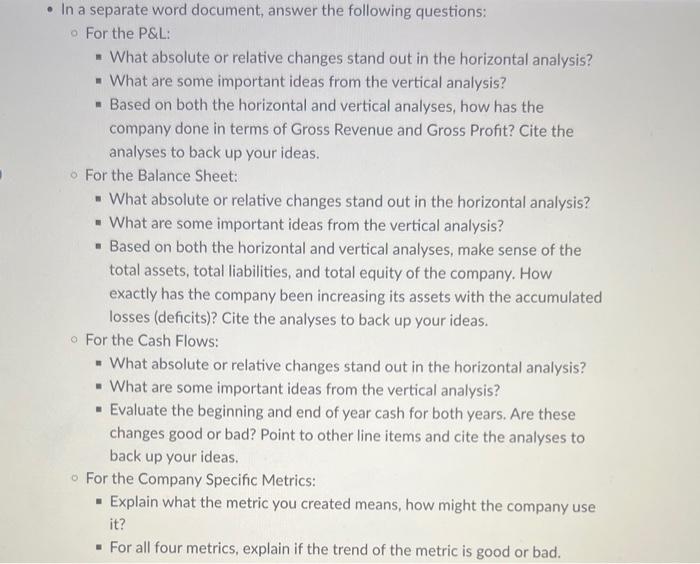
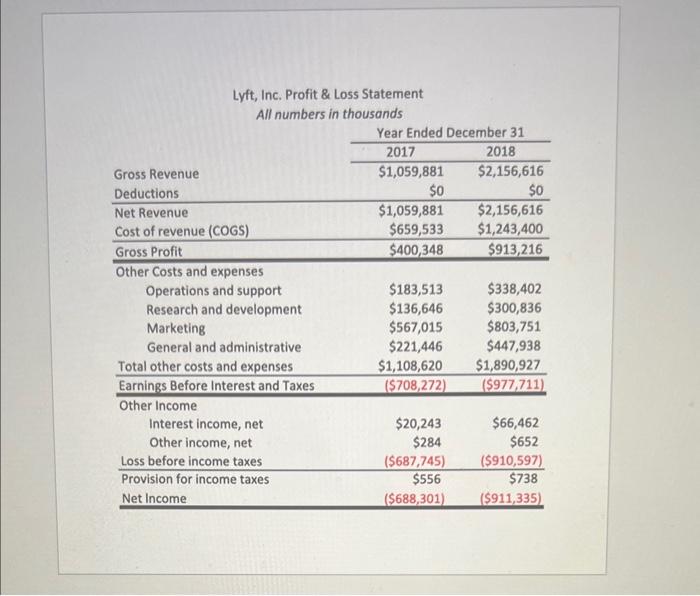
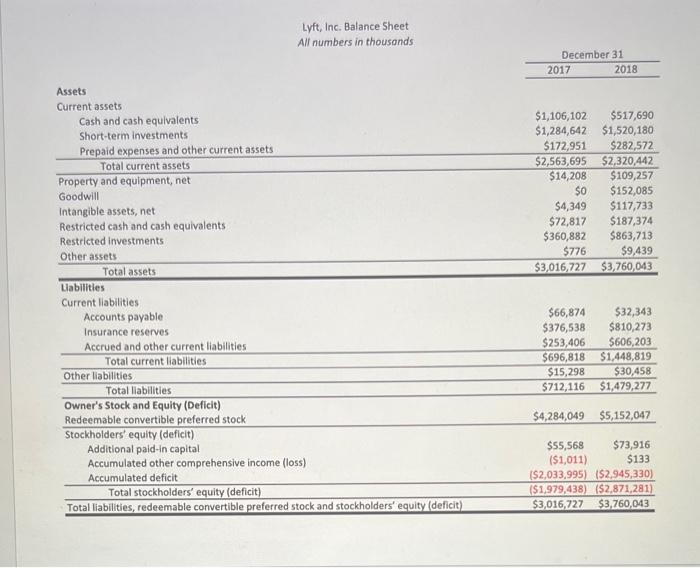
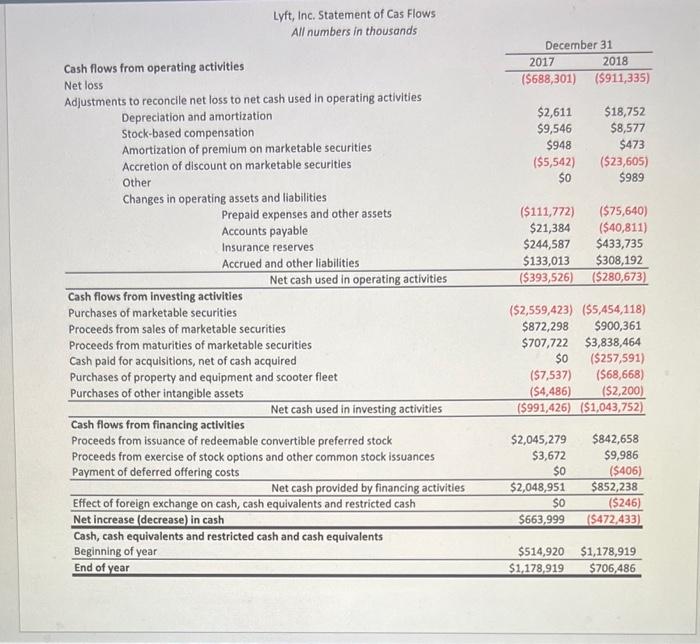
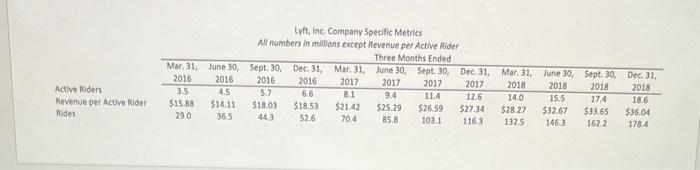
Assignment Overview This project will require you to show your ability to create and understand the following financial analyses: 1. Comparative Horizontal 2. Common-Size Vertical 3. Averages 4. Trends The data required for the assignment is here: Link to Data The data is Lyft Inc.'s financial statements and key company metrics that were made public prior to their IPO. It is organized across four different worksheets that include four different sets of financial data: a P\&Ls for 2017 and 2018 , Balance Sheets for 2017 and 2018, Statemnt of Cash Flows for 2017 and 2018, and three different company specific metrics. Resources you should use for this assignments are as follows (links to readings and class slides that cover these analyses): 1. 7 Introduction to Financial Statements-1pptx 3. 9 Analyzing and Understanding Financial Statements - Pt2.pptx 4. SEC (2007) pdf 5. Merrill Lynch (2003),pdf - Start by conducting the following analyses in the excel workbook. You will turn this in! Comparative horizontal analyses of the P\&L, Balance Sheet, and Cash Flows from 2017 to 2018 including both absolute and relative changes for each line item. For all of these analyses, you can include them on the same worksheet that the data is located. Be sure to label and give titles to be clear what you are presenting. Be sure all numbers are formatted correctly! Common-size vertical analysis of the P\&L, Balance Sheet, and Cash Flows for both 2017 and 2018. Use Net Revenue for the P\&L common-size, Total Assets for the Balance Sheet common-size, and Beginning of Year Total Cash for the Cash Flows. For all of these analyses, you can include them on the same worksheet that the data is located. Be sure to label and give titles to be clear what you are presenting. Be sure all numbers are formatted correctly! In the fourth worksheet "Company Specific Metrics", calculate the average number of rides per active rider for each of the three month periods. In addition, conduct trend analyses (both absolute and relative) for all four of these metrics (the three originally provided and the fourth you just created). For all of these analyses, you can include them on the same worksheet that the data is located. Be sure to label and give titles to be clear what you are presenting. Be sure all numbers are formatted correctlv! For the P\&L: - What absolute or relative changes stand out in the horizontal analysis? - What are some important ideas from the vertical analysis? - Based on both the horizontal and vertical analyses, how has the company done in terms of Gross Revenue and Gross Profit? Cite the analyses to back up your ideas. For the Balance Sheet: - What absolute or relative changes stand out in the horizontal analysis? - What are some important ideas from the vertical analysis? - Based on both the horizontal and vertical analyses, make sense of the total assets, total liabilities, and total equity of the company. How exactly has the company been increasing its assets with the accumulated losses (deficits)? Cite the analyses to back up your ideas. For the Cash Flows: - What absolute or relative changes stand out in the horizontal analysis? - What are some important ideas from the vertical analysis? - Evaluate the beginning and end of year cash for both years. Are these changes good or bad? Point to other line items and cite the analyses to back up your ideas. For the Company Specific Metrics: - Explain what the metric you created means, how might the company use it? - For all four metrics, explain if the trend of the metric is good or bad. Lyft, Inc. Profit \& Loss Statement Lyft, Inc. Balance Sheet All numbers in thousonds \begin{tabular}{c} \multicolumn{2}{c}{ December 31} \\ \hline 20172018 \\ \hline \end{tabular} Assets Current assets Cash and cash equivalents Short-term investments Total assets \begin{tabular}{rr} $1,106,102 & $517,690 \\ $1,284,642 & $1,520,180 \\ $172,951 & $282,572 \\ \hline$2,563,695 & $2,320,442 \\ \hline$14,208 & $109,257 \\ $0 & $152,085 \\ $4,349 & $117,733 \\ $72,817 & $187,374 \\ $360,882 & $863,713 \\ $776 & $9,439 \\ \hline$3,016,727 & $3,760,043 \\ \hline \end{tabular} Labilities Current liabilities Accounts payable Insurance reserves Accrued and other current liabilities Total current liabilities Total liabilities Owner's Stock and Equity (Deficit) Redeemable convertible preferred stock $4,284,049$5,152,047 Stockholders' equity (deficit) Additional paid-in capital Accumulated other comprehensive income (loss) Accumulated deficit Total stockholders' equity (deficit) Total liabilities, redeemable convertible preferred stock and stockholders' equity (deficit) Lyft, Inc. Statement of Cas Flows All numbers in thousands Cash flows from operating activities Net loss \begin{tabular}{cc} \multicolumn{2}{c}{ December 31 } \\ \hline 2017 & 2018 \\ \hline($688,301) & ($911,335) \end{tabular} Adjustments to reconcile net loss to net cash used in operating activities Depreciation and amortization Stock-based compensation Amortization of premium on marketable securities Accretion of discount on marketable securities Other $2,611$9,546$948($5,542)$0$18,752$8,577$473($23,605)$989 Changes in operating assets and liabilities Cash flows from investing activities Purchases of marketable securities Proceeds from sales of marketable securities Proceeds from maturities of marketable securities Cash paid for acquisitions, net of cash acquired Purchases of property and equipment and scooter fleet Purchases of other intangible assets Net cash used in investing activities \begin{tabular}{rr} ($2,559,423) & ($5,454,118) \\ $872,298 & $900,361 \\ $707,722 & $3,838,464 \\ $0 & ($257,591) \\ ($7,537) & ($68,668) \\ ($4,486) & ($2,200) \\ \hline($991,426) & ($1,043,752) \\ \hline \end{tabular} Cash flows from financing activities Proceeds from issuance of redeemable convertible preferred stock Proceeds from exercise of stock options and other common stock issuances $2,045,279$3,672$842,658$9,986 Payment of deferred offering costs Effect of foreign exchange on cash, cash equivalents and restricted cash Net increase (decrease) in cash Cash, cash equivalents and restricted cash and cash equivalents Beginning of year End of year \begin{tabular}{rr} $514,920 & $1,178,919 \\ \hline$1,178,919 & $706,486 \\ \hline \end{tabular} Lyft, inc. Company Specific Metric: All numbers in millions except Revenue per Active Rider Assignment Overview This project will require you to show your ability to create and understand the following financial analyses: 1. Comparative Horizontal 2. Common-Size Vertical 3. Averages 4. Trends The data required for the assignment is here: Link to Data The data is Lyft Inc.'s financial statements and key company metrics that were made public prior to their IPO. It is organized across four different worksheets that include four different sets of financial data: a P\&Ls for 2017 and 2018 , Balance Sheets for 2017 and 2018, Statemnt of Cash Flows for 2017 and 2018, and three different company specific metrics. Resources you should use for this assignments are as follows (links to readings and class slides that cover these analyses): 1. 7 Introduction to Financial Statements-1pptx 3. 9 Analyzing and Understanding Financial Statements - Pt2.pptx 4. SEC (2007) pdf 5. Merrill Lynch (2003),pdf - Start by conducting the following analyses in the excel workbook. You will turn this in! Comparative horizontal analyses of the P\&L, Balance Sheet, and Cash Flows from 2017 to 2018 including both absolute and relative changes for each line item. For all of these analyses, you can include them on the same worksheet that the data is located. Be sure to label and give titles to be clear what you are presenting. Be sure all numbers are formatted correctly! Common-size vertical analysis of the P\&L, Balance Sheet, and Cash Flows for both 2017 and 2018. Use Net Revenue for the P\&L common-size, Total Assets for the Balance Sheet common-size, and Beginning of Year Total Cash for the Cash Flows. For all of these analyses, you can include them on the same worksheet that the data is located. Be sure to label and give titles to be clear what you are presenting. Be sure all numbers are formatted correctly! In the fourth worksheet "Company Specific Metrics", calculate the average number of rides per active rider for each of the three month periods. In addition, conduct trend analyses (both absolute and relative) for all four of these metrics (the three originally provided and the fourth you just created). For all of these analyses, you can include them on the same worksheet that the data is located. Be sure to label and give titles to be clear what you are presenting. Be sure all numbers are formatted correctlv! For the P\&L: - What absolute or relative changes stand out in the horizontal analysis? - What are some important ideas from the vertical analysis? - Based on both the horizontal and vertical analyses, how has the company done in terms of Gross Revenue and Gross Profit? Cite the analyses to back up your ideas. For the Balance Sheet: - What absolute or relative changes stand out in the horizontal analysis? - What are some important ideas from the vertical analysis? - Based on both the horizontal and vertical analyses, make sense of the total assets, total liabilities, and total equity of the company. How exactly has the company been increasing its assets with the accumulated losses (deficits)? Cite the analyses to back up your ideas. For the Cash Flows: - What absolute or relative changes stand out in the horizontal analysis? - What are some important ideas from the vertical analysis? - Evaluate the beginning and end of year cash for both years. Are these changes good or bad? Point to other line items and cite the analyses to back up your ideas. For the Company Specific Metrics: - Explain what the metric you created means, how might the company use it? - For all four metrics, explain if the trend of the metric is good or bad. Lyft, Inc. Profit \& Loss Statement Lyft, Inc. Balance Sheet All numbers in thousonds \begin{tabular}{c} \multicolumn{2}{c}{ December 31} \\ \hline 20172018 \\ \hline \end{tabular} Assets Current assets Cash and cash equivalents Short-term investments Total assets \begin{tabular}{rr} $1,106,102 & $517,690 \\ $1,284,642 & $1,520,180 \\ $172,951 & $282,572 \\ \hline$2,563,695 & $2,320,442 \\ \hline$14,208 & $109,257 \\ $0 & $152,085 \\ $4,349 & $117,733 \\ $72,817 & $187,374 \\ $360,882 & $863,713 \\ $776 & $9,439 \\ \hline$3,016,727 & $3,760,043 \\ \hline \end{tabular} Labilities Current liabilities Accounts payable Insurance reserves Accrued and other current liabilities Total current liabilities Total liabilities Owner's Stock and Equity (Deficit) Redeemable convertible preferred stock $4,284,049$5,152,047 Stockholders' equity (deficit) Additional paid-in capital Accumulated other comprehensive income (loss) Accumulated deficit Total stockholders' equity (deficit) Total liabilities, redeemable convertible preferred stock and stockholders' equity (deficit) Lyft, Inc. Statement of Cas Flows All numbers in thousands Cash flows from operating activities Net loss \begin{tabular}{cc} \multicolumn{2}{c}{ December 31 } \\ \hline 2017 & 2018 \\ \hline($688,301) & ($911,335) \end{tabular} Adjustments to reconcile net loss to net cash used in operating activities Depreciation and amortization Stock-based compensation Amortization of premium on marketable securities Accretion of discount on marketable securities Other $2,611$9,546$948($5,542)$0$18,752$8,577$473($23,605)$989 Changes in operating assets and liabilities Cash flows from investing activities Purchases of marketable securities Proceeds from sales of marketable securities Proceeds from maturities of marketable securities Cash paid for acquisitions, net of cash acquired Purchases of property and equipment and scooter fleet Purchases of other intangible assets Net cash used in investing activities \begin{tabular}{rr} ($2,559,423) & ($5,454,118) \\ $872,298 & $900,361 \\ $707,722 & $3,838,464 \\ $0 & ($257,591) \\ ($7,537) & ($68,668) \\ ($4,486) & ($2,200) \\ \hline($991,426) & ($1,043,752) \\ \hline \end{tabular} Cash flows from financing activities Proceeds from issuance of redeemable convertible preferred stock Proceeds from exercise of stock options and other common stock issuances $2,045,279$3,672$842,658$9,986 Payment of deferred offering costs Effect of foreign exchange on cash, cash equivalents and restricted cash Net increase (decrease) in cash Cash, cash equivalents and restricted cash and cash equivalents Beginning of year End of year \begin{tabular}{rr} $514,920 & $1,178,919 \\ \hline$1,178,919 & $706,486 \\ \hline \end{tabular} Lyft, inc. Company Specific Metric: All numbers in millions except Revenue per Active Rider