Answered step by step
Verified Expert Solution
Link Copied!

Question

1 Approved Answer

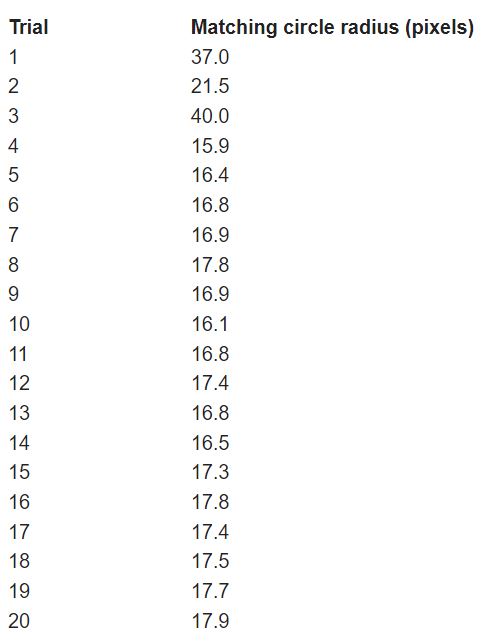
Hello, I need help with this quesiton on One-sample T-test. Trial Matching circle radius (pixels) 37.0 21.5 40.0 15.9 16.4 ( 0 N O) UI

Hello, I need help with this quesiton on One-sample T-test.

image text in transcribedimage text in transcribedimage text in transcribedimage text in transcribed
Trial Matching circle radius (pixels) 37.0 21.5 40.0 15.9 16.4 ( 0 N O) UI A W N - 16.8 16.9 17.8 16.9 10 16.1 11 16.8 12 17.4 13 16.8 14 16.5 15 17.3 16 17.8 17 17.4 18 17.5 19 17.7 20 17.9Formulas To calculate the ttest statistic, you need to rst calculate the mean and standard deviation of the matching circle radius scores. This is done in the rst three questions. The standard deviation is used to calculate the standard error of the mean 5 3:7. X a New compute the ttest statistic which has degrees of freedom df=n1. Finally, you can calculate the p-value for the test statistic. This is most easily done with an online calculator. Be sure to use a one-tailed test. Answer the questions using the data below. You will often nd it helpful to sort the data and calculate values using a spreadsheet such as Microsoft Excel, Sheets from Google apps. Open Ofce, or Numbers (Mac only). To import the data into a spreadsheet select and copy all the cells in the trial-by-triai data table below and then paste them into an open page of the spreadsheet. On each triai, you adjusted the size of an isolated green circle so that it appeared to be the same size as another circle that was surrounded by larger circles. What do we predict participants will do? Why? The presence of the larger surrounding circles often introduces a size illusion, so that the surrounded circle appears smaller than it would by itself. As a result, we expect participants will adjust the isolated circle to be physically smaller than the true size of the surrounded circle. By adjusting the isolated circle to be physically smaller, it will perceptually look the same size as the surrounded circle. In the statistical analysis of the data, you carry out a one-tailed hypothesis test to determine whether you have evidence for the illusion. That is, you are looking to see it you have evidence that the matching sizes are smaller (on average) than the true physical size (20 pixels in radius). The null hypothesis is H0: u = 20. and the alternative hypothesis is Ha: u

Step by Step Solution

There are 3 Steps involved in it

Step: 1

blur-text-image

Get Instant Access to Expert-Tailored Solutions

See step-by-step solutions with expert insights and AI powered tools for academic success

Step: 2

blur-text-image

Step: 3

blur-text-image

Ace Your Homework with AI

Get the answers you need in no time with our AI-driven, step-by-step assistance

Get Started

Recommended Textbook for

Calculus Early Transcendentals

Authors: Michael Sullivan, Kathleen Miranda

2nd Edition

1319067484, 9781319067489

More Books

Students also viewed these Mathematics questions