hello,
i need your help please for these questions
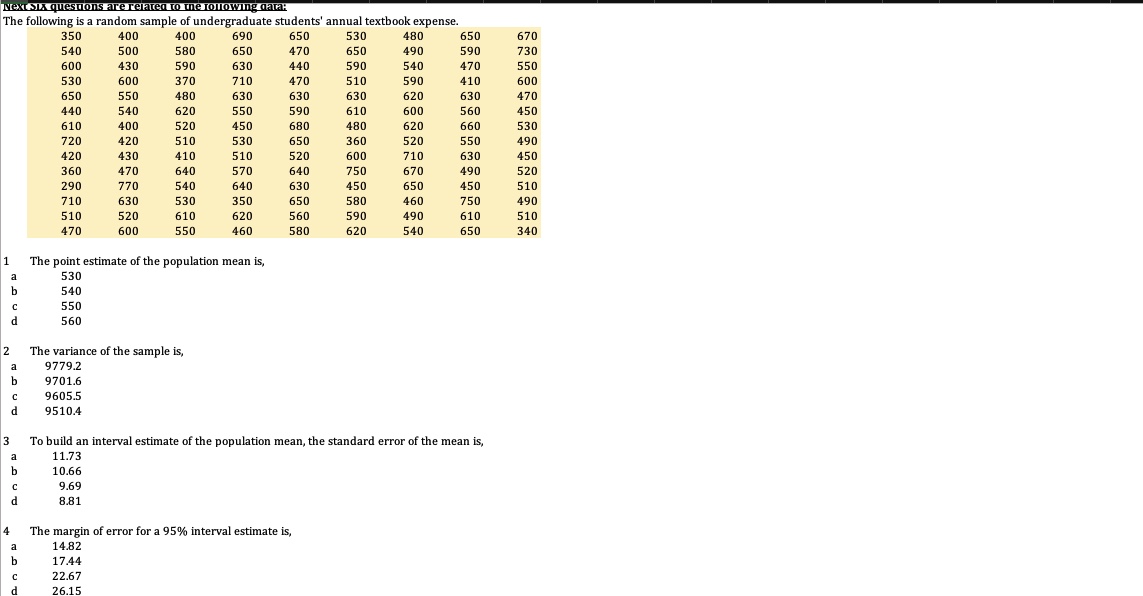
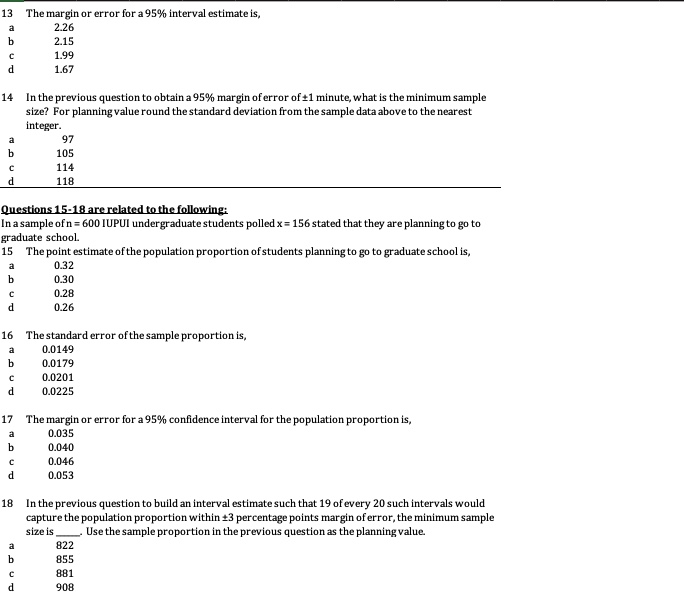
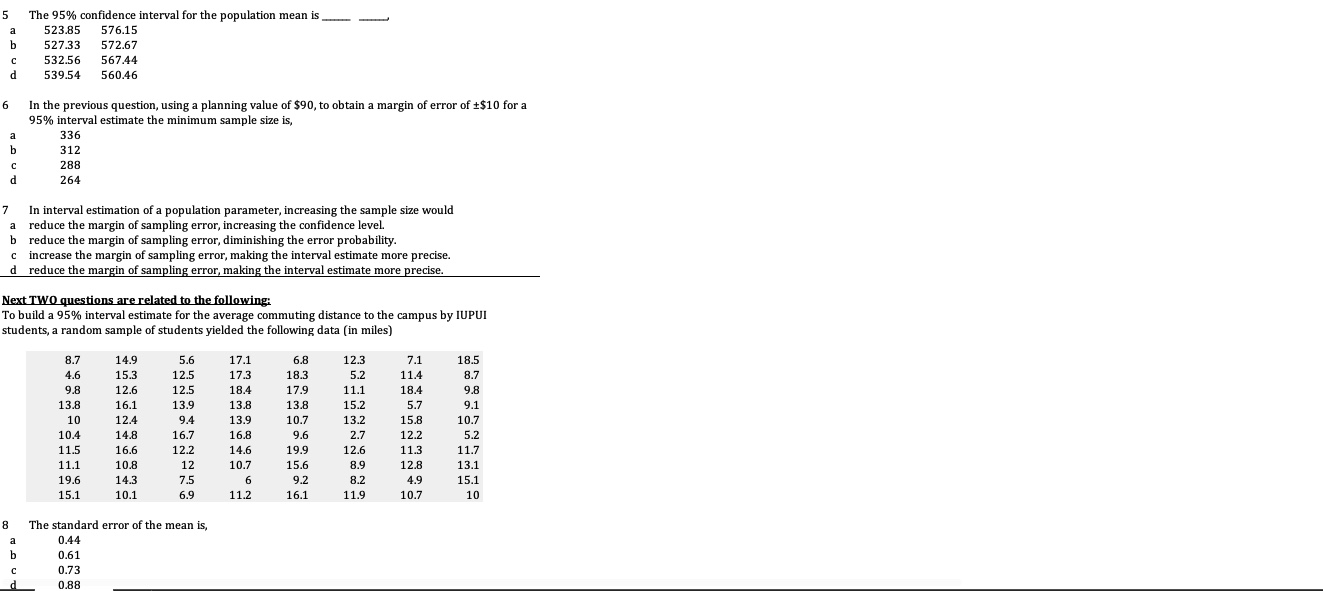
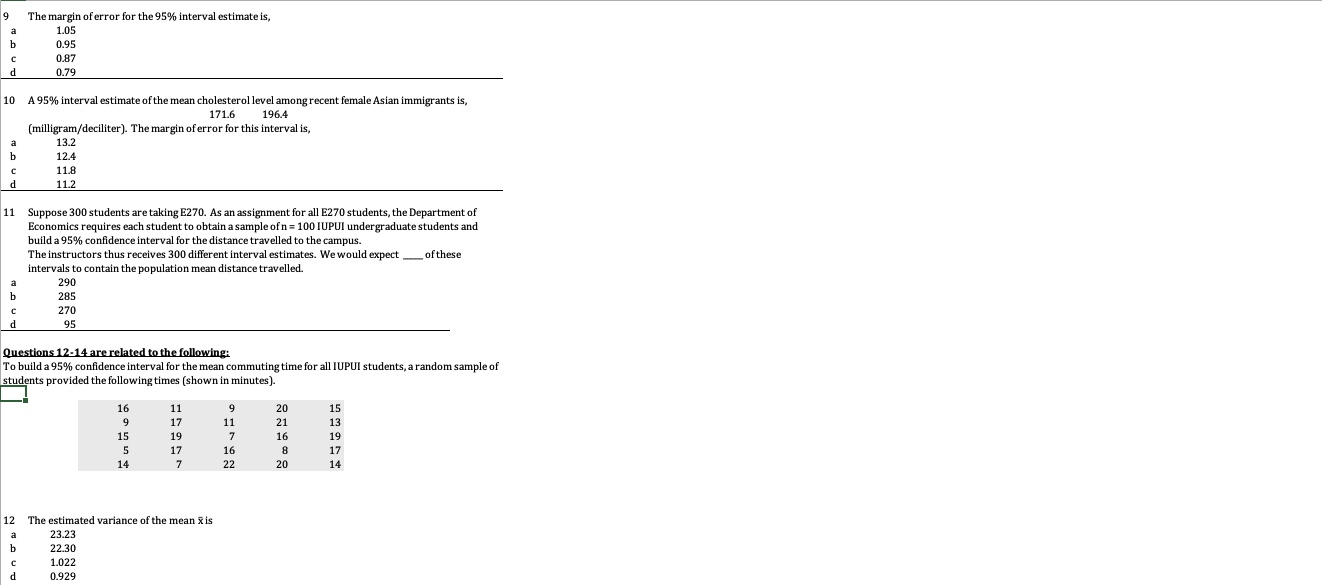
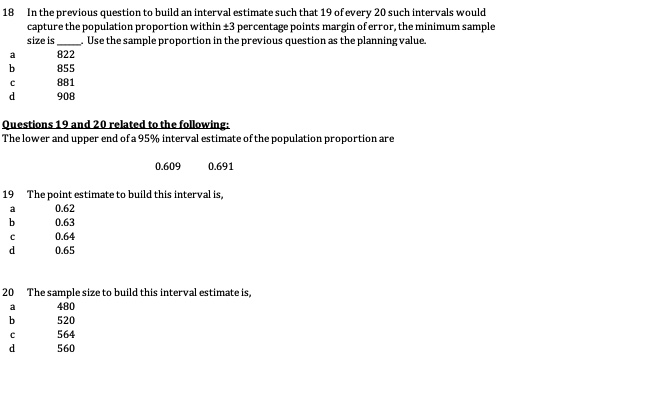
Next SIA questions are related to the following data: The following is a random sample of undergraduate students' annual textbook expense. 350 400 400 590 650 530 480 650 670 540 500 580 650 470 650 490 590 730 600 430 590 630 440 590 540 470 550 530 600 370 710 470 510 590 410 600 650 550 480 630 630 630 620 630 470 440 540 620 550 590 610 600 560 450 610 400 520 450 680 480 620 660 530 720 420 510 530 650 360 520 550 490 420 430 410 510 520 600 710 630 450 360 470 640 570 640 750 670 190 520 290 770 540 640 630 450 650 450 510 710 630 530 350 650 580 460 750 490 510 520 610 620 560 590 490 610 510 470 600 550 460 580 620 540 650 340 The point estimate of the population mean is, 530 540 550 560 2 The variance of the sample is, 9779.2 9701.6 9605.5 9510.4 To build an interval estimate of the population mean, the standard error of the mean is, 11.73 10.66 9.69 8.81 The margin of error for a 95% interval estimate is, 14.82 17.44 22.67 26.1513 The margin or error for a 95% interval estimate is, 2.26 2.15 1.99 1.67 14 In the previous question to obtain a 95% margin of error of $1 minute, what is the minimum sample size? For planning value round the standard deviation from the sample data above to the nearest integer. 97 105 114 118 Questions 15-18 are related to the following: In a sample of n = 600 IUPUI undergraduate students polled x = 156 stated that they are planning to go to graduate school. 15 The point estimate of the population proportion of students planning to go to graduate school is, 0.32 0.30 0.28 0.26 16 The standard error of the sample proportion is, 10149 0.0179 0.0201 0.0225 17 The margin or error for a 95% confidence interval for the population proportion is, 0.035 0.040 0.046 0.053 18 In the previous question to build an interval estimate such that 19 of every 20 such intervals would capture the population proportion within $3 percentage points margin of error, the minimum sample size is Use the sample proportion in the previous question as the planning value. 822 855 881 908The 95% confidence interval for the population mean is 523.85 576.15 527.33 572.67 532.56 567.44 539.54 560.46 6 In the previous question, using a planning value of $90, to obtain a margin of error of +$10 for a 95% interval estimate the minimum sample size is, 336 312 288 264 In interval estimation of a population parameter, increasing the sample size would reduce the margin of sampling error, increasing the confidence level. reduce the margin of sampling error, diminishing the error probability. increase the margin of sampling error, making the interval estimate more precise. reduce the margin of sampling error, making the interval estimate more precise. Next TWO questions are related to the following: To build a 95% interval estimate for the average commuting distance to the campus by IUPUI students, a random sample of students yielded the following data (in miles) 8.7 14.9 5.6 17.1 6.8 12.3 7.1 18.5 4.6 15.3 12.5 17.3 18.3 5.2 11.4 8.7 9.8 12.6 12.5 18.4 17.9 11.1 18.4 9.8 13.8 16.1 13.9 13.8 13.8 15.2 5.7 9.1 10 12.4 9.4 13.9 10.7 13.2 15.8 10.7 10.4 14.8 16.7 16.8 9.6 2.7 12.2 5.2 11.5 16.6 12.2 14.6 19.9 12.6 11.3 11.7 11.1 10.8 12 10.7 15.6 8.9 12.8 13.1 19.6 14.3 7.5 9.2 8.2 4.9 15.1 15.1 10.1 6.9 11.2 16.1 11.9 10.7 10 8 The standard error of the mean is, 0.44 0.61 0.73 0.889 The margin of error for the 95% interval estimate is, 1.05 0.95 0.79 0 A 95% interval estimate of the mean cholesterol level among recent female Asian immigrants is, 171.6 196.4 (milligram/deciliter). The margin of error for this interval is, 13.2 12.4 11.8 11.2 11 Suppose 300 students are taking E270. As an assignment for all E270 students, the Department of Economics requires each student to obtain a sample of n = 100 IUPUI undergraduate students and build a 95% confidence interval for the distance travelled to the campus. The instructors thus receives 300 different interval estimates. We would expect of these intervals to contain the population mean distance travelled. 290 285 270 95 Questions 12-14 are related to the following: To build a 95% confidence interval for the mean commuting time for all IUPUI students, a random sample of students provided the following times (shown in minutes). 16 11 20 15 9 17 11 21 13 15 19 7 16 19 un 17 16 8 17 14 7 22 20 14 12 The estimated variance of the mean x is 23.23 22.30 1.022 0.92918 In the previous question to build an interval estimate such that 19 of every 20 such intervals would capture the population proportion within $3 percentage points margin of error, the minimum sample size is Use the sample proportion in the previous question as the planning value. 822 855 881 908 Questions 19 and 20 related to the following: The lower and upper end of a 95% interval estimate of the population proportion are 0.609 0.691 19 The point estimate to build this interval is, 0.62 b 0.63 C 0.64 0.65 20 The sample size to build this interval estimate is, 480 520 564 560
