Answered step by step
Verified Expert Solution
Question
1 Approved Answer
Hello, I really need help with this chemistry work! I have provided my work I have done and also provided blank work that I need
Hello, I really need help with this chemistry work! I have provided my work I have done and also provided blank work that I need help on. Someone please take the time and show me how to do each step! Please check my work on the first page to see if I did it correct or incorrect. As much as I care about getting a good grade on this, I care more about understanding how to do the work. Please show me steps, if you do not mind. Thank you so much! 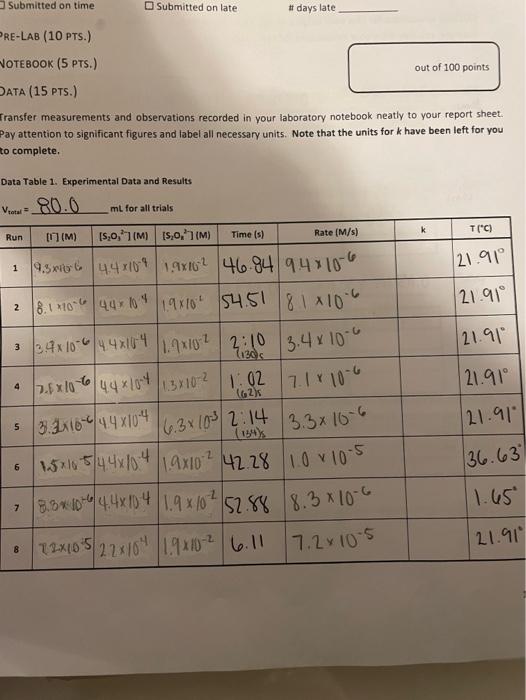
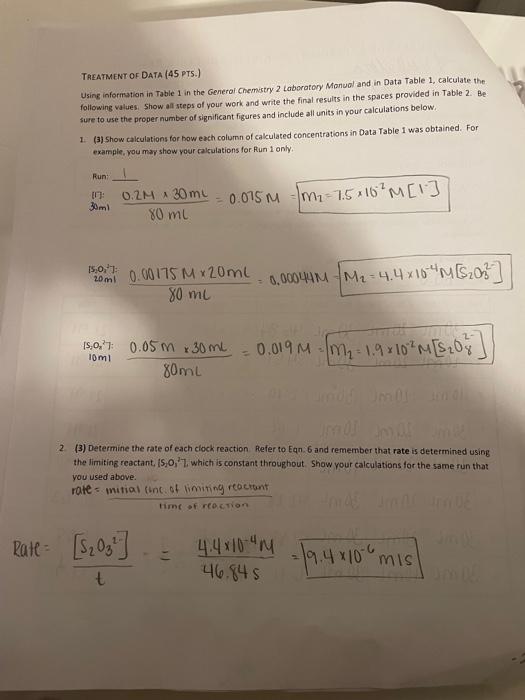
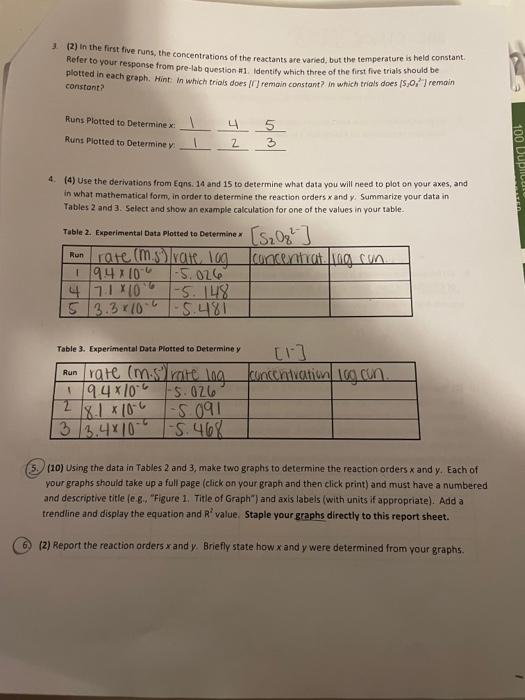
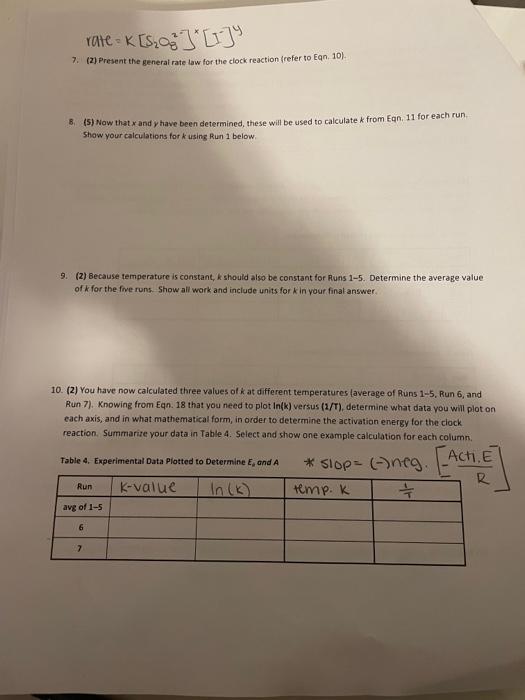
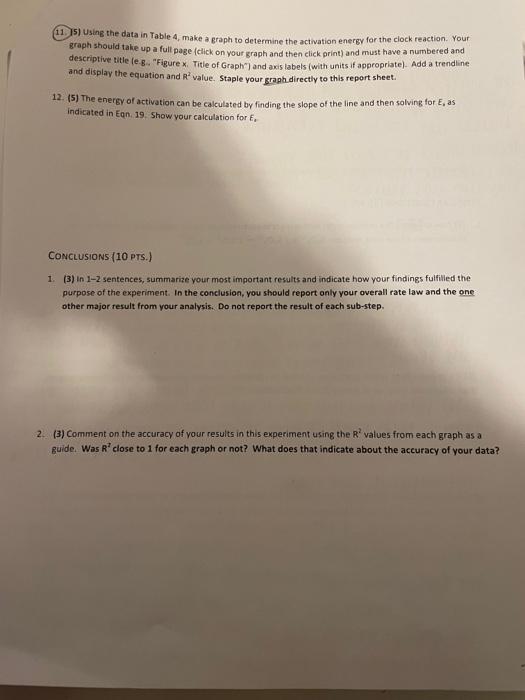
[ransfer measurements and observations recorded in your laboratory notebook neatly to your report sheet. Pay attention to significant figures and label all necessary units. Note that the units for k have been left for you to complete. TAEATMENT OF DATA (45 PTS.) Using information in Table 1 in the Generol Chemistry 2 Laboratory Monuol and in Data Table 1, calculate the. following values. Show all steps of your work and write the final results in the spaces provided in Table 2. Be: sure to use the proper number of significant figures and include all units in your calculations below. 1. (3) Show calculations for bow each column of calculated concentrations in Data Table i was obtained. For example, you mar show your cakculations for Run 1 only. 20mi15.0,77:80mL0.00175M20mL=0.00044M=M2=4.4104M[S2OO32] 2. (3) Determine the rate of each clock reaction Refer to Eqn. 6 and remember that rate is determined using the limiting reactant, [5,0,27, which is constant throughout. Show your calculations for the same run that you used above. He =t[S2O32]=46.84s4.4104M=9.4106m1s] 3. (2) in the first five runs, the concentrations of the reactants are varied, but the temperature is heid constant. Refer to your response from pre-lab question #1. Identify which three of the first fire trials should be plotted in each graph. Hint. in which trials does [II remain constant? in which trials does [5, J2] remain canstont? Runs Plotted to Determine x:412435 Runs Plotted to Determine y: 4. (4) Use the derivations from Eqns. 14 and 15 to determine what data you will need to plot on your axes, and in what mathematical form, in order to determine the reaction orders x and y. Summarize your data in Tables 2 and 3 . Select and show an example calculation tor one of the values in your table. Table 2. Experimental Data Plotted to Determine x Table 3. Experimental Data Piotted to Determine y 5. (10) Using the data in Tables 2 and 3, make two graphs to determine the reaction orders x and y. Each of your graphs should take up a full page (click on your graph and then click print) and must have a numbered and descriptive title (e. g.. "Figure 1. Title of Graph" ) and axis labels (with units if appropriate). Add a trendline and display the equation and R2 value. Staple your graphs directly to this report sheet. 6) (2) Report the reaction orders x and y. Briefly state how x and y were determined from your graphs. 7. (2) Present the general rate law for the clock reaction (refer to Eqn. 10). 8. (5) Now that x and y have been determined, these will be used to calculate k from Eqn. 11 for each run. shaw your calculations for k using Run 1 below. 9. (2) Because temperature is constant, k should alsa be constant for Runs 15. Determine the average value of k for the fme runs. Show ali work and include units for k in your final answer. 10. (2) You have now calculated three values of k at different temperatures laverage of Runs 15, Run 6 , and Run 7). Knowing from Eqn. 18 that you need to plot ln(k) versus (2/T), determine what data you will plot on each axis, and in what mathematical form, in order to determine the activation energy for the ciock reaction. Summarize your data in Table 4. Select and show one example calculation for each column. 11. 15) Using the data in Table 4, make a graph to determine the activation energy for the clock reaction. Your graph should take up a fult page (click on your graph and then click print) and must have a numbered and descriptive title (e.g. "Figure x. Title of Graph?) and axis labels (with units if appropriate). Add a trendline and display the equation and A2 value. Staple your graph directly to this report sheet. 12. (5) The energy of activation can be calculated by finding the slope of the line and then solving for E,as indicated in Eqn. 19. Show your calculation for E, CONCLUSIONS ( 10 PTS.) 1. (3) In 1-2 sentences, summarize your most important results and indicate how your findings fulfilled the purpose of the experiment. In the conclusion, you should report only your overall rate law and the one: other major result from your analysis. Do not report the result of each sub-step. 2. (3) Comment on the accuracy of your results in this experiment using the R2 values from each graph as a guide. Was R2 close to 1 for each graph or not? What does that indicate about the accuracy of your data? [ransfer measurements and observations recorded in your laboratory notebook neatly to your report sheet. Pay attention to significant figures and label all necessary units. Note that the units for k have been left for you to complete. TAEATMENT OF DATA (45 PTS.) Using information in Table 1 in the Generol Chemistry 2 Laboratory Monuol and in Data Table 1, calculate the. following values. Show all steps of your work and write the final results in the spaces provided in Table 2. Be: sure to use the proper number of significant figures and include all units in your calculations below. 1. (3) Show calculations for bow each column of calculated concentrations in Data Table i was obtained. For example, you mar show your cakculations for Run 1 only. 20mi15.0,77:80mL0.00175M20mL=0.00044M=M2=4.4104M[S2OO32] 2. (3) Determine the rate of each clock reaction Refer to Eqn. 6 and remember that rate is determined using the limiting reactant, [5,0,27, which is constant throughout. Show your calculations for the same run that you used above. He =t[S2O32]=46.84s4.4104M=9.4106m1s] 3. (2) in the first five runs, the concentrations of the reactants are varied, but the temperature is heid constant. Refer to your response from pre-lab question #1. Identify which three of the first fire trials should be plotted in each graph. Hint. in which trials does [II remain constant? in which trials does [5, J2] remain canstont? Runs Plotted to Determine x:412435 Runs Plotted to Determine y: 4. (4) Use the derivations from Eqns. 14 and 15 to determine what data you will need to plot on your axes, and in what mathematical form, in order to determine the reaction orders x and y. Summarize your data in Tables 2 and 3 . Select and show an example calculation tor one of the values in your table. Table 2. Experimental Data Plotted to Determine x Table 3. Experimental Data Piotted to Determine y 5. (10) Using the data in Tables 2 and 3, make two graphs to determine the reaction orders x and y. Each of your graphs should take up a full page (click on your graph and then click print) and must have a numbered and descriptive title (e. g.. "Figure 1. Title of Graph" ) and axis labels (with units if appropriate). Add a trendline and display the equation and R2 value. Staple your graphs directly to this report sheet. 6) (2) Report the reaction orders x and y. Briefly state how x and y were determined from your graphs. 7. (2) Present the general rate law for the clock reaction (refer to Eqn. 10). 8. (5) Now that x and y have been determined, these will be used to calculate k from Eqn. 11 for each run. shaw your calculations for k using Run 1 below. 9. (2) Because temperature is constant, k should alsa be constant for Runs 15. Determine the average value of k for the fme runs. Show ali work and include units for k in your final answer. 10. (2) You have now calculated three values of k at different temperatures laverage of Runs 15, Run 6 , and Run 7). Knowing from Eqn. 18 that you need to plot ln(k) versus (2/T), determine what data you will plot on each axis, and in what mathematical form, in order to determine the activation energy for the ciock reaction. Summarize your data in Table 4. Select and show one example calculation for each column. 11. 15) Using the data in Table 4, make a graph to determine the activation energy for the clock reaction. Your graph should take up a fult page (click on your graph and then click print) and must have a numbered and descriptive title (e.g. "Figure x. Title of Graph?) and axis labels (with units if appropriate). Add a trendline and display the equation and A2 value. Staple your graph directly to this report sheet. 12. (5) The energy of activation can be calculated by finding the slope of the line and then solving for E,as indicated in Eqn. 19. Show your calculation for E, CONCLUSIONS ( 10 PTS.) 1. (3) In 1-2 sentences, summarize your most important results and indicate how your findings fulfilled the purpose of the experiment. In the conclusion, you should report only your overall rate law and the one: other major result from your analysis. Do not report the result of each sub-step. 2. (3) Comment on the accuracy of your results in this experiment using the R2 values from each graph as a guide. Was R2 close to 1 for each graph or not? What does that indicate about the accuracy of your data 


Step by Step Solution
There are 3 Steps involved in it
Step: 1

Get Instant Access to Expert-Tailored Solutions
See step-by-step solutions with expert insights and AI powered tools for academic success
Step: 2

Step: 3

Ace Your Homework with AI
Get the answers you need in no time with our AI-driven, step-by-step assistance
Get Started


