

Question
hello i want you help with code matlab this my code what i just want you to do is to insert the number in the
hello i want you help with code matlab this my code what i just want you to do is to insert the number in the picture and and run it show the figures.
%Question#01% %____________________________% clc clear all close all figure %__________________________________________________________% % Matlab 3 session was based upon 3 main discrete functions: %__________________________________________________________% %step, filter and cov %Examples are given as: %____Example#01_____% %Use of Step, inline and subplot command n=[-5:10]; f1=inline('cos(2*n)'); subplot(1,3,1) stem(n,f1(n),'k') title('Q#01 Example 1') xlabel('n') ylabel('f1(n)') %_____Example#02_______% %Use of Filter command with other commands %Let, y(n)-y(n-2)-y(n-3)=x(n), x(n)=u(n-1) subplot(1,3,2) b=[1 0 0]; a=[1 -1 -1]; x=inline('heaviside(n-1)'); f2=filter(b,a,x(n)); stem(n,f2,'r') title('Q#01 Example 2') xlabel('n') ylabel('f2(n)') %________Example#03____________% %Use of conv command___% subplot(1,3,3) h=sin(n); x=heaviside(n); f3=conv(h,x); stem([-5:25],f3) title('Q#01 Example 3') xlabel('n') ylabel('f3(n)')
%Question#02 %__________________% figure n=[1:30]; x1= heaviside(n)-heaviside(n-20); x2= heaviside(n+15)-heaviside(n-25); x3= ((1/2).^n).*(heaviside(n+2)-heaviside(n-15)); subplot(1,3,1) stem(n,x1,'r') title('Q#2(a) Plot of x1(n)') xlabel('n') ylabel('x1(n)') subplot(1,3,2) stem(n,x2,'k') title(' Q#2(b) Plot of x2(n)') xlabel('n') ylabel('x2(n)') subplot(1,3,3) stem(n,x3) title('Q#2(c) Plot of x3(n)') xlabel('n') ylabel('x3(n)')
%Question#03 %__________________% figure %(a) n=[0:25]; b=[1 0 0]; a=[1 -0.75 0.1]; x=inline('n==0','n'); f1a=filter(b,a,x(n)); subplot(1,3,1) stem(n,f1a,'r') title('Q#3(a) Impulse response') xlabel('n') ylabel('h(n)') %(b) subplot(1,3,2) impz(b,a) title('Q#3(b) Impulse response') xlabel('n') ylabel('h(n)-') subplot(1,3,3) f2b=impz(b,a); f2b=f2b'; m=max(size(f2b)); l=max(size(n)); o=l-m; A=zeros(1,o); f2=[f2b A]; %Finding the difference between impulse response of (a) and (b) h_diff=f1a-f2; stem(n,h_diff,'k') title('Diff. B/W h(n) of (a) & (b)') xlabel('n') ylabel('h_diff(n)') figure %Zero input response z_i=filtic(b,a,[1 2]); y_zi=filter(b,a,zeros(size(n)),z_i); subplot(1,3,1) stem(n,y_zi,'r') title('Zero-Input Response') xlabel('n') ylabel('y_zi') %Total response %Since, x(n)=u(n)-u(n-10) x=inline('heaviside(n)-heaviside(n-10)','n'); Y_T=filter(b,a,x(n),z_i); %Zero-State Response y_zs=Y_T-y_zi subplot(1,3,2) stem(n,y_zs,'k') title('Zero-State Response') xlabel('n') ylabel('y_zs') subplot(1,3,3) stem(n,Y_T) title('Total Response') xlabel('n') ylabel('Y_T')
question one leave it the same the only change you going to in question 2 and 3.
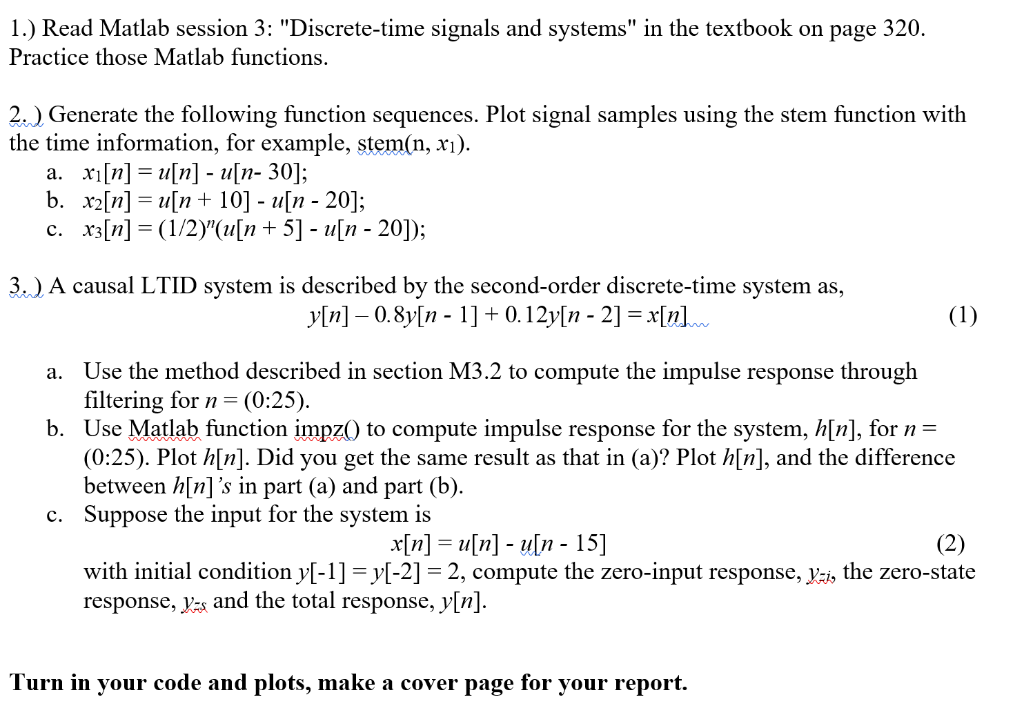
1.) Read Matlab session 3: "Discrete-time signals and systems" in the textbook on page 320. Practice those Matlab functions, 2. Generate the following function sequences. Plot signal samples using the stem function with the time information, for example, stem(n, xi). xi [n] = u[n] -11[17-30]; x2[n]-u[n + 10]- u[n - 20]; a. b. 3.) A causal LTID system is described by the second-order discrete-time system as, y[n] - 0.8y[n - 1]+0.12y[n - 2] x[n Use the method described in section M3.2 to compute the impulse response throug filtering for n - (0:25) Use Matlab function imPA) to compute impulse response for the system, h[n], for n = (0:25). Plot h[n]. Did you get the same result as that in (a)? Plot h[n], and the difference between h[n] 's in part (a) and part (b) Suppose the input for the system is a. b. c. x[n] = u[n]-u[n- 15] with initial condition y[-1]-y[-2]2, compute the zero-input response, v-, the zero-state response, and the total response, y[n] Turn in your code and plots, make a cover page for your reportStep by Step Solution
There are 3 Steps involved in it
Step: 1

Get Instant Access to Expert-Tailored Solutions
See step-by-step solutions with expert insights and AI powered tools for academic success
Step: 2

Step: 3
Ace Your Homework with AI
Get the answers you need in no time with our AI-driven, step-by-step assistance
Get Started
Essentials of Database Management
Authors: Jeffrey A. Hoffer, Heikki Topi, Ramesh Venkataraman
1st edition
133405680, 9780133547702 , 978-0133405682