

Question
Hello I was wondering how I would interpret a KS (Kolmogorov Smirnov) in these types of charts. As well an explanation of the threshold (0.2402)
Hello
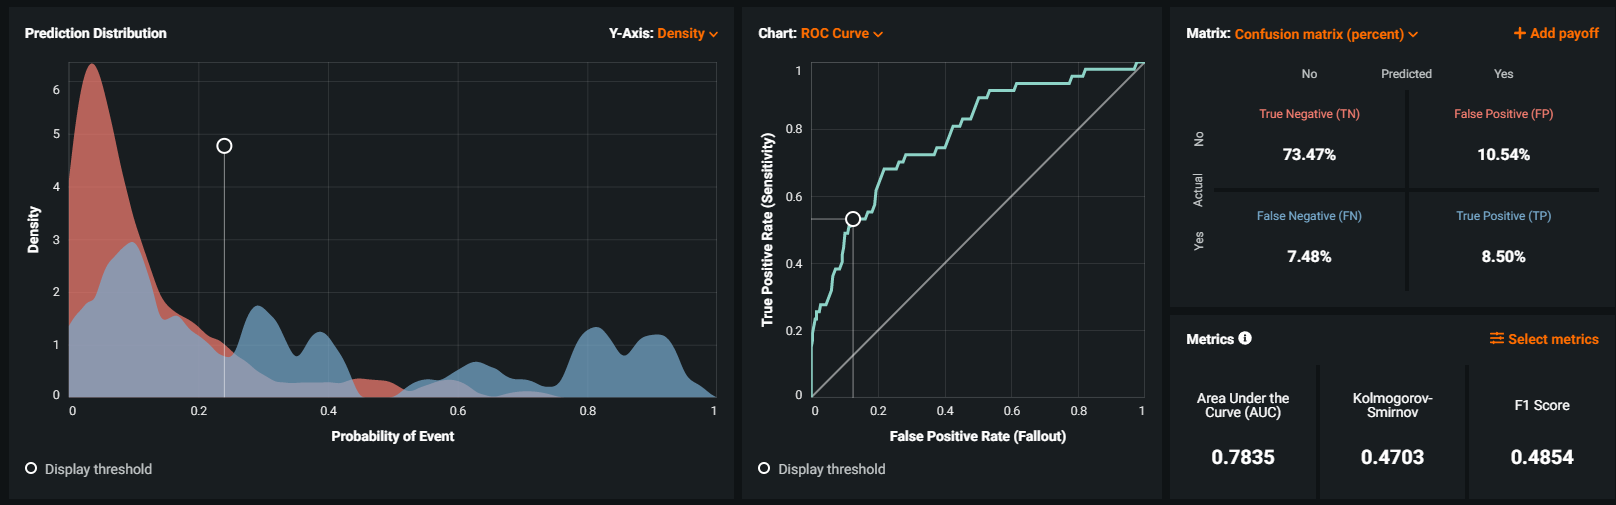
I was wondering how I would interpret a KS (Kolmogorov Smirnov) in these types of charts.
As well an explanation of the threshold (0.2402) and ways I can interpret that on the visual graph to the left. (the line with the ball at the top is the threshold indicator).
Step by Step Solution
There are 3 Steps involved in it
Step: 1

Get Instant Access to Expert-Tailored Solutions
See step-by-step solutions with expert insights and AI powered tools for academic success
Step: 2

Step: 3
Ace Your Homework with AI
Get the answers you need in no time with our AI-driven, step-by-step assistance
Get Started
Finite Math And Applied Calculus
Authors: Stefan Waner, Steven Costenoble
6th Edition
1285415132, 9781285415130