Hello, I was wondering if my answers are correct? If not what am I doing wrong?
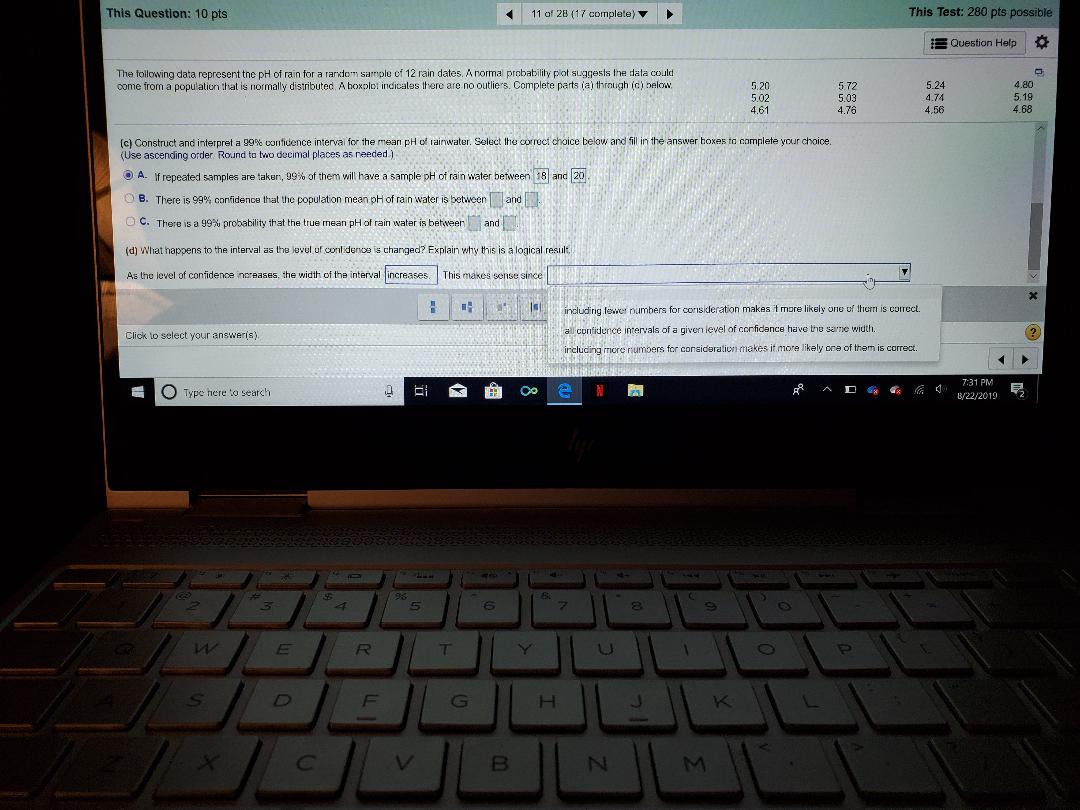
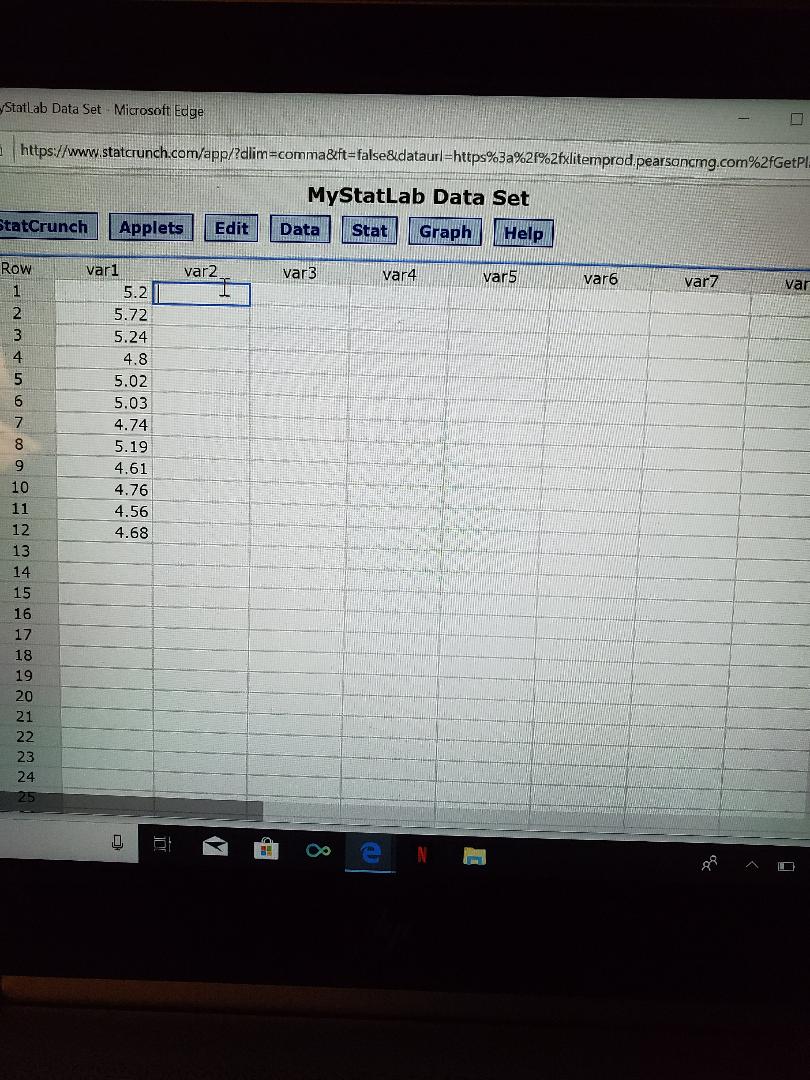
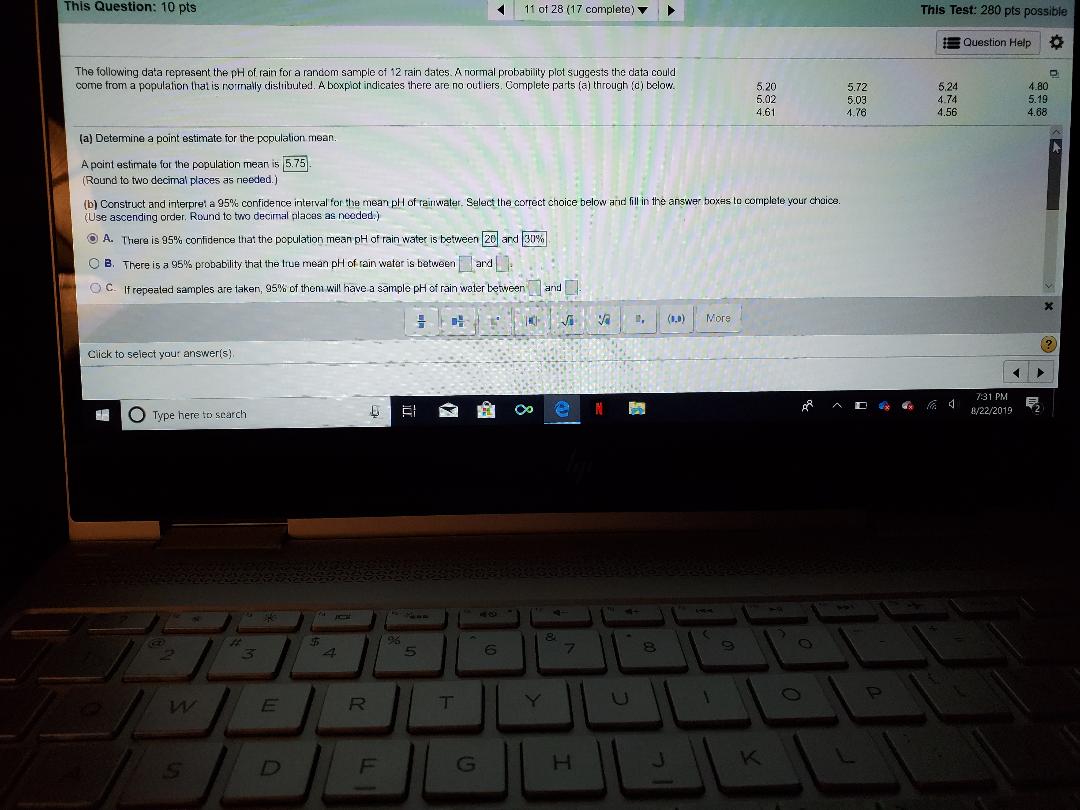
This Question: 10 pts 11 of 28 (17 complete) This Test: 280 pts possible Question Help The following data represent the pH of rain for a random sample of 12 rain dates, A norma probability pot suggests the data could come from a population that is normally distributed A boxplot indicates there are no outliers. Complete parts (a) through (d ) below 5:20 5.72 5.24 4.80 5.02 5.03 4.74 5.19 4.61 4.76 4.56 4 68 [c) Construct and interpret a 29 confidence interval for the mean PH of rainwater. Select the correct choice below and fill in the answer boxes in complete your choice. (Use ascending order Round to two decimal places as needed ) 9 A. If repeated samples are taken, 39%% of them will have a sample ph of rain water between 18 and 20 B. There is 99%% confidence that the population mean ph of rain water is between | and C. There is a 99% probability that the true mean pH of rain water is between and (d) What happens to the interval as the level uf cont dence is changed? Explain why this is a logical result As the level of confidence increases, the width of the interval increases. This makes sense since X including fewer numbers for consideration makes it more likely one of them is correct. Click to select your answeris) all contidence intervals of a given level of confidence have the same width. including more numbers for consideration makes it more likely one of them is correct. Type here to search N 7:31 PM B/22/2019 2 7 W E R T S D F G H K X C V B N MStatLab Data Set Microsoft Edge https://www.statcrunch.com/app/?dlim=comma&ft=false&dataurl=https%3a%21%2fxlitemprod.pearsoncig.com%2fGetP MyStatLab Data Set tatCrunch Applets Edit Data Stat Graph Help Row var1 var2 var3 var4 var5 var6 var7 va 5.2 5.72 5.24 4.8 5.02 5.03 4.74 4 00 5.19 4.61 10 4.76 11 4.56 12 4.68 13 14 15 16 17 18 19 20 21 22 23 24 25 Oo e N AThis Question: 10 pts |11 of 28 (17 complete) > > This Test: 280 pts possible Question Help The following data represent the pH of rain for a random sample of 12 rain dates. A normal probability plot suggests the data could come from a population that is normally distributed. A boxplot indicates there are no out iers. Complete parts (a) through (d) below. 5,20 5.72 5.24 180 6.02 5.03 4.74 5.19 4.61 4.76 4.56 4 68 (a) Determine a point estimate for the population mean. A point estimate for the population mean is 5.75 Round to two decimal places as needed.) (b) Construct and interpret a 95% confidence interval for the mean pl of rainwater. Select the correct choice below and fill in the answer boxes to complete your choice. Use ascending order, Round to two decimal places as needed.) O A. There is 95% confidence that the population mean pH of rain water is between 20 and 30% O B. There is a 95% probability that the true mean pl of rain water is between | |and . QC. If repeated samples are taken, 95%% of them will have a sample ph of rain water between ]and Va (LD) More Click to select your answer(s) ? e N 7:31 PM Type here to search 1/22/2019 4- 96 2 3 -7 W E R T Y U P D F G H K