Answered step by step
Verified Expert Solution
Link Copied!

Question

1 Approved Answer

Hello. Im struggling with this second part of the lab. Any help is appreciated thank you The second exercise (40 points) produces x,y values using

Hello. Im struggling with this second part of the lab. Any help is appreciated thank you image text in transcribed
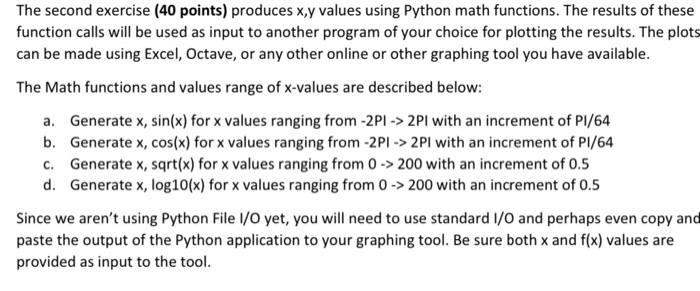
image text in transcribed
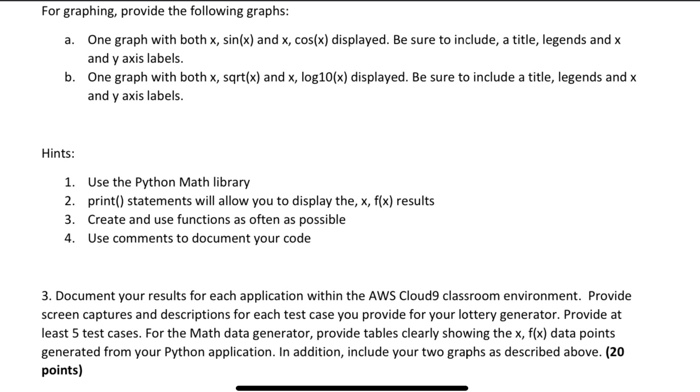
The second exercise (40 points) produces x,y values using Python math functions. The results of these function calls will be used as input to another program of your choice for plotting the results. The plots can be made using Excel, Octave, or any other online or other graphing tool you have available. The Math functions and values range of x-values are described below: a. Generate x, sin(x) for x values ranging from -2PI -> 2PI with an increment of P1/64 b. Generate x, cos(x) for x values ranging from -2PI -> 2PI with an increment of P1/64 c. Generate x, sqrt(x) for x values ranging from 0 -> 200 with an increment of 0.5 d. Generate x, log10(x) for x values ranging from 0 -> 200 with an increment of 0.5 Since we aren't using Python File I/O yet, you will need to use standard I/O and perhaps even copy and paste the output of the Python application to your graphing tool. Be sure both x and f(x) values are provided as input to the tool. For graphing, provide the following graphs: a. One graph with both x, sin(x) and X, cos(x) displayed. Be sure to include, a title, legends and x and y axis labels. b. One graph with both x, sqrt(x) and x, log10(x) displayed. Be sure to include a title, legends and x and y axis labels. Hints: 1. Use the Python Math library 2.print() statements will allow you to display the, x, f(x) results 3. Create and use functions as often as possible 4. Use comments to document your code 3. Document your results for each application within the AWS Cloud9 classroom environment. Provide screen captures and descriptions for each test case you provide for your lottery generator. Provide at least 5 test cases. For the Math data generator, provide tables clearly showing the x, f(x) data points generated from your Python application. In addition, include your two graphs as described above. (20 points)

Step by Step Solution

There are 3 Steps involved in it

Step: 1

blur-text-image

Get Instant Access to Expert-Tailored Solutions

See step-by-step solutions with expert insights and AI powered tools for academic success

Step: 2

blur-text-image_2

Step: 3

blur-text-image_3

Ace Your Homework with AI

Get the answers you need in no time with our AI-driven, step-by-step assistance

Get Started

Recommended Textbook for

Machine Learning And Knowledge Discovery In Databases European Conference Ecml Pkdd 2014 Nancy France September 15 19 2014 Proceedings Part 2 Lnai 8725

Authors: Toon Calders ,Floriana Esposito ,Eyke Hullermeier ,Rosa Meo

2014th Edition

3662448505, 978-3662448502

More Books

Students also viewed these Databases questions