Hello! | need help with this statistics project that requires difference between two means. | have parts of it done however, need some help for
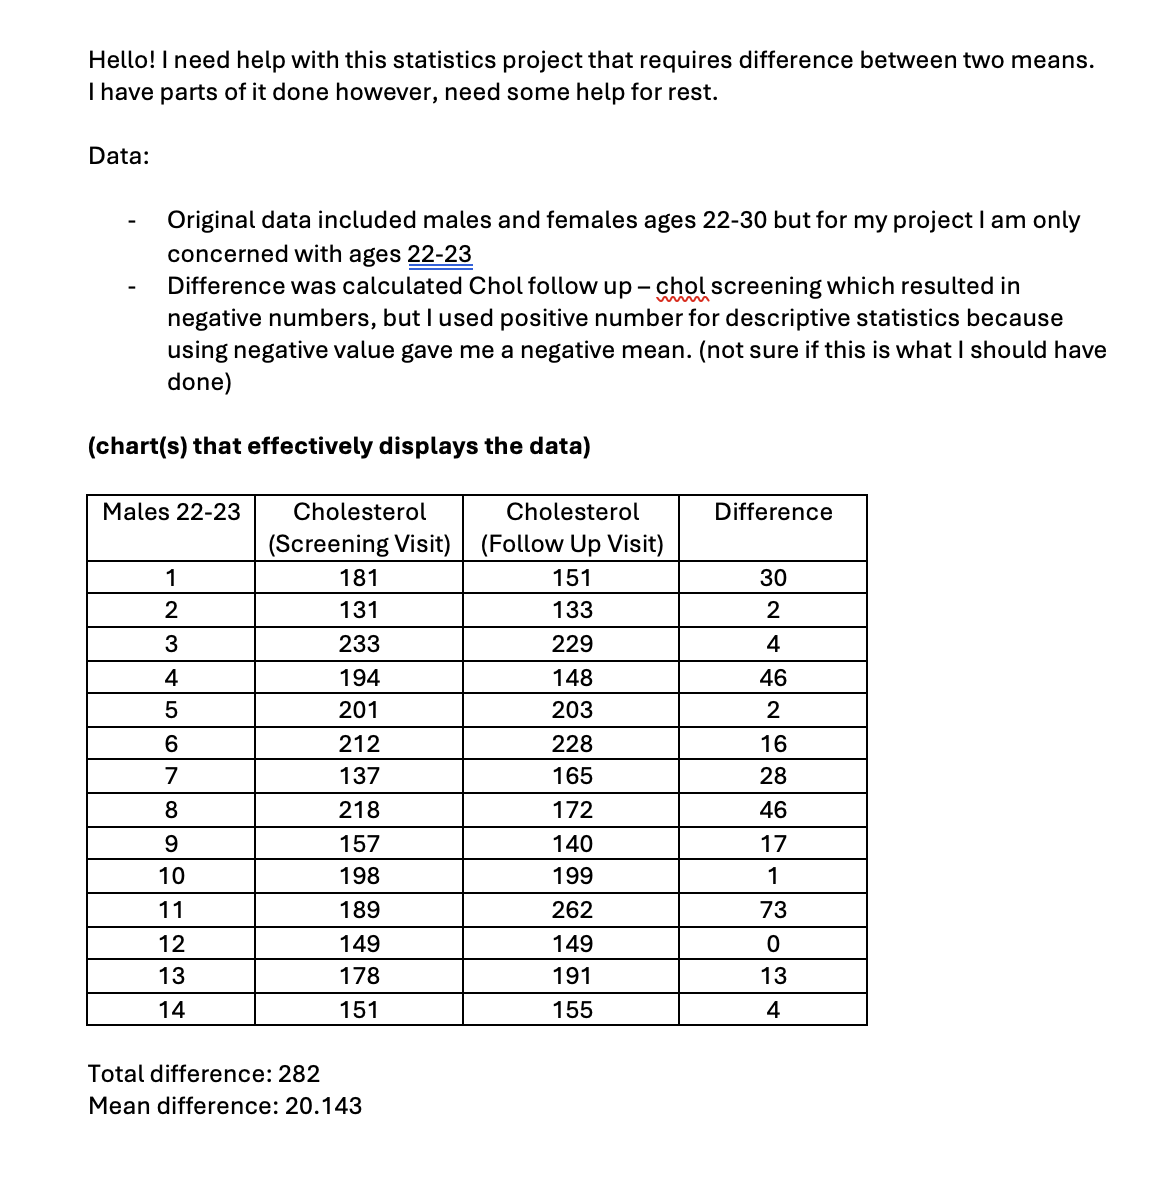
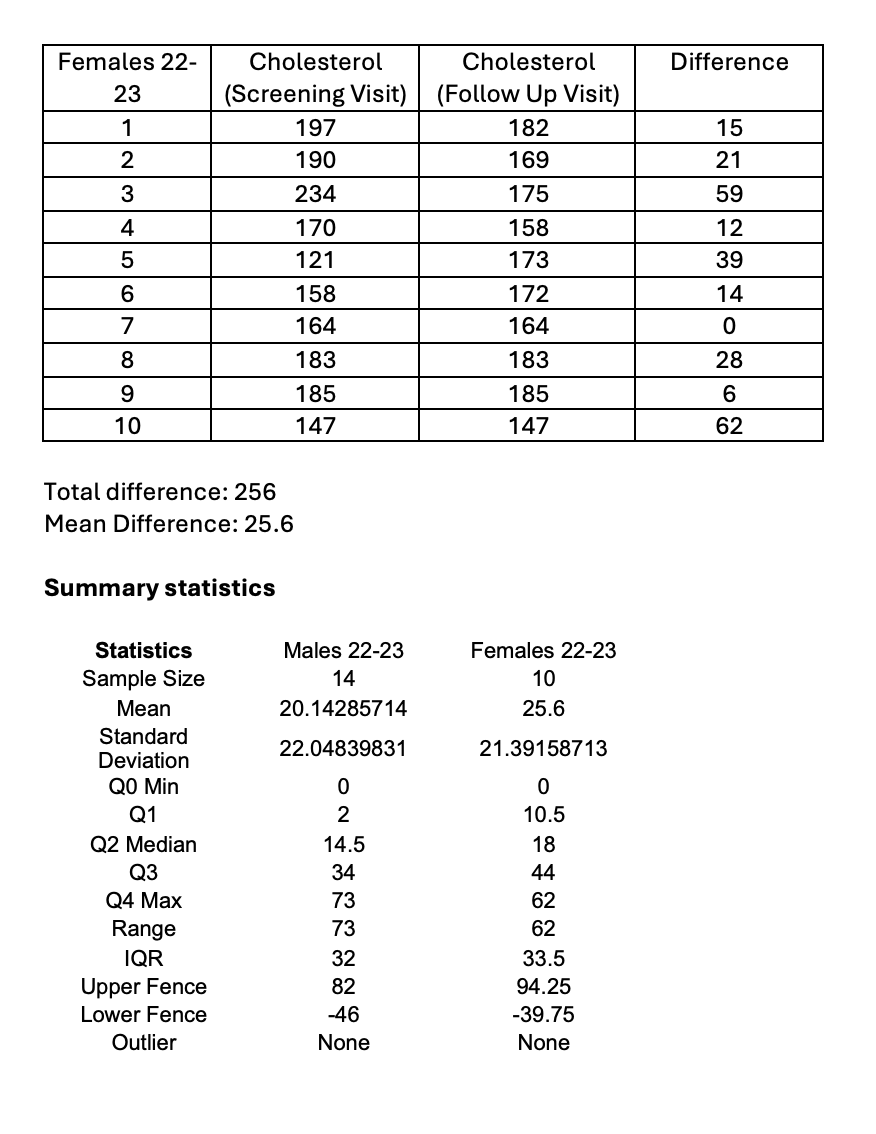
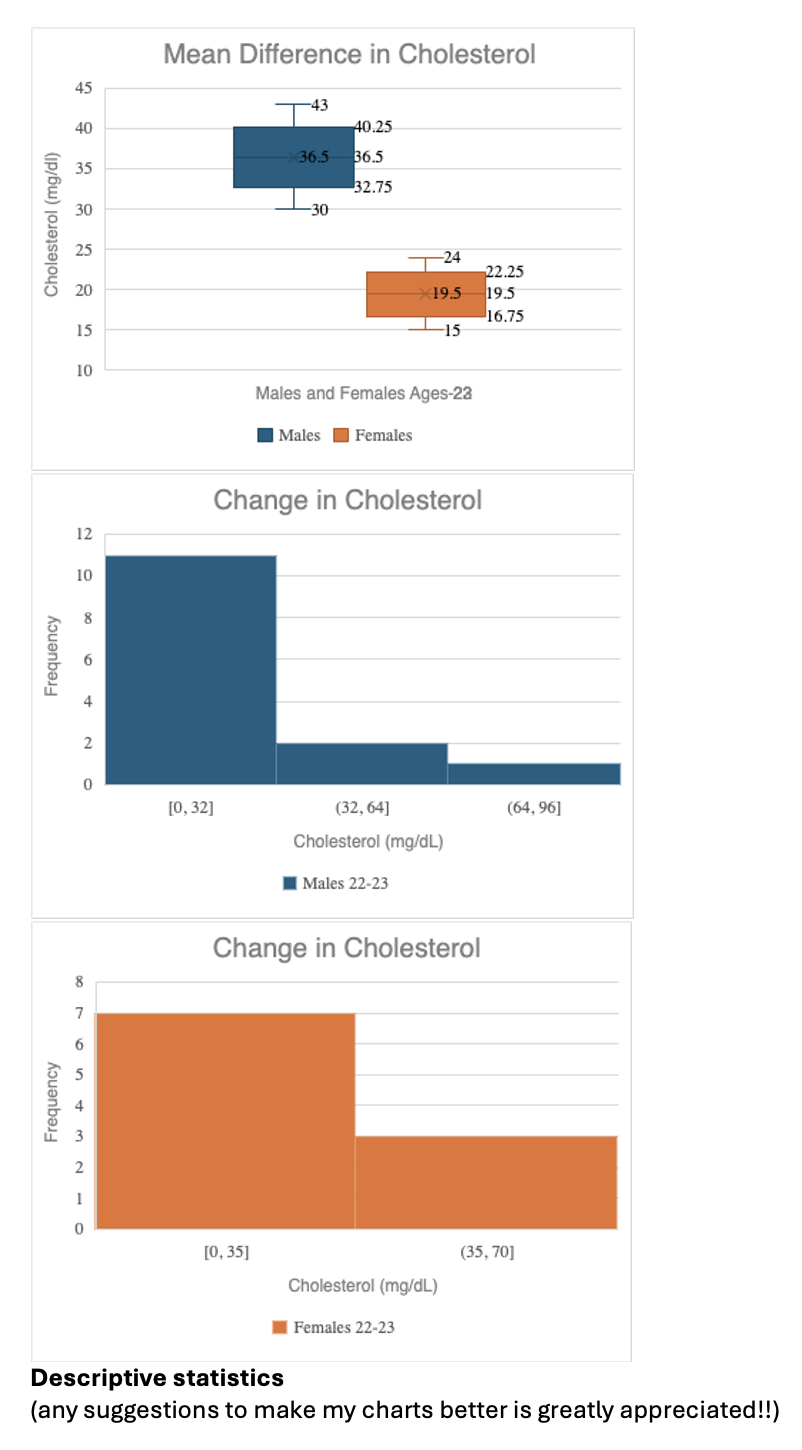
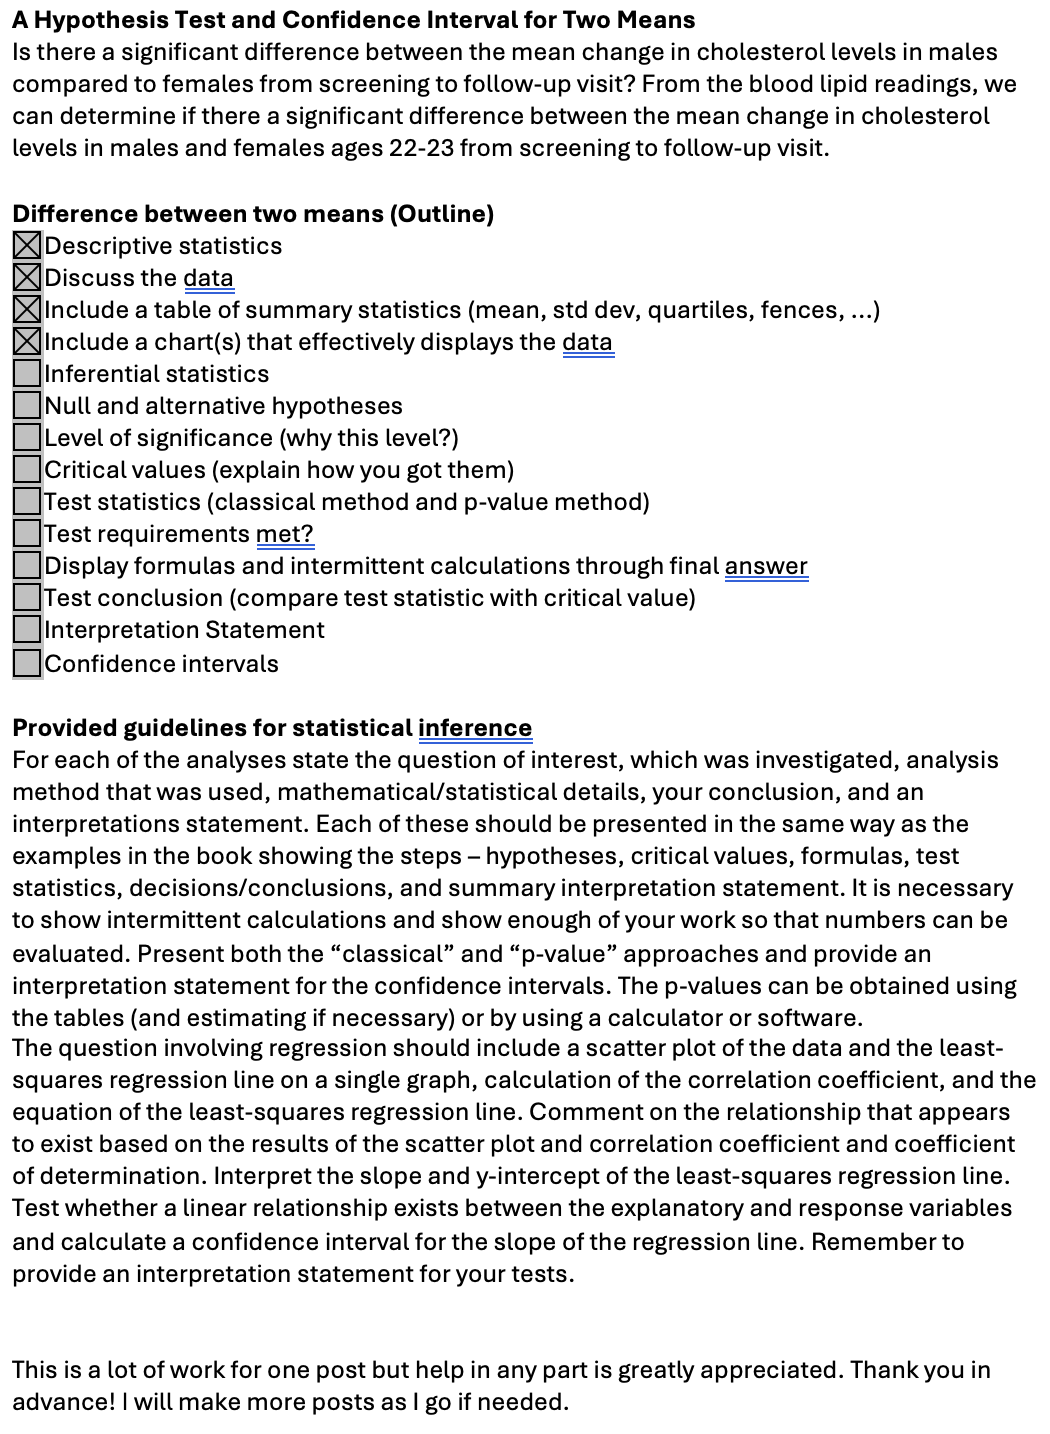
Hello! | need help with this statistics project that requires difference between two means. | have parts of it done however, need some help for rest. Data: - Original data included males and females ages 22-30 but for my project |l am only concerned with ages 22-23 - Difference was calculated Chol follow up chol screening which resulted in negative numbers, but | used positive number for descriptive statistics because using negative value gave me a negative mean. (not sure if this is what | should have done) (chart(s) that effectively displays the data) Total difference: 282 Mean difference: 20.143 Females 22- Cholesterol Cholesterol Difference 23 (Screening Visit) (Follow Up Visit) 197 182 15 2 190 169 21 234 175 59 A 170 158 12 121 173 39 6 158 172 14 164 164 0 8 183 183 28 9 185 185 6 10 147 147 62 Total difference: 256 Mean Difference: 25.6 Summary statistics Statistics Males 22-23 Females 22-23 Sample Size 14 10 Mean 20.14285714 25.6 Standard Deviation 22.04839831 21.39158713 QO Min 0 Q1 2 10.5 Q2 Median 14.5 18 Q3 34 44 Q4 Max 73 62 Range 73 62 IQR 32 33.5 Upper Fence 82 94.25 Lower Fence -46 -39.75 Outlier None None45 35 30 25 Cholesterol (mg/dl) 20 Frequency Frequency b W = b o -] e Mean Difference in Cholesterol 24 2.25 195 16.75 15 Males and Females Ages-23 Il Males [l Females Change in Cholesterol [0.32] (32.64] (64, 96] Cholesterol (mg/dL) W Males 22-23 Change in Cholesterol [0, 35] (35,70] Cholesterol (mg/dL) M Females 22-23 Descriptive statistics (any suggestions to make my charts better is greatly appreciated!!) A Hypothesis Test and Confidence Interval for Two Means Is there a significant difference between the mean change in cholesterol levels in males compared to females from screening to follow-up visit? From the blood lipid readings, we can determine if there a significant difference between the mean change in cholesterol levels in males and females ages 22-23 from screening to follow-up visit. Difference between two means (Outline) XlDescriptive statistics XlDiscuss the data |Z|Include a table of summary statistics (mean, std dev, quartiles, fences, ...) Xinclude a chart(s) that effectively displays the data [ Jinferential statistics |:|NuLL and alternative hypotheses [ ]Level of significance (why this level?) [ ]Critical values (explain how you got them) |:|Test statistics (classical method and p-value method) |:|Test requirements met? |:|Display formulas and intermittent calculations through final answer |:|Test conclusion (compare test statistic with critical value) Dlnterpretation Statement [ ]Confidence intervals Provided guidelines for statistical inference For each of the analyses state the question of interest, which was investigated, analysis method that was used, mathematical/statistical details, your conclusion, and an interpretations statement. Each of these should be presented in the same way as the examples in the book showing the steps - hypotheses, critical values, formulas, test statistics, decisions/conclusions, and summary interpretation statement. It is necessary to show intermittent calculations and show enough of your work so that numbers can be evaluated. Present both the \"classical\" and \"p-value\" approaches and provide an interpretation statement for the confidence intervals. The p-values can be obtained using the tables (and estimating if necessary) or by using a calculator or software. The question involving regression should include a scatter plot of the data and the least- squares regression line on a single graph, calculation of the correlation coefficient, and the equation of the least-squares regression line. Comment on the relationship that appears to exist based on the results of the scatter plot and correlation coefficient and coefficient of determination. Interpret the slope and y-intercept of the least-squares regression line. Test whether a linear relationship exists between the explanatory and response variables and calculate a confidence interval for the slope of the regression line. Remember to provide an interpretation statement for your tests. This is a lot of work for one post but help in any part is greatly appreciated. Thank you in advance! | will make more posts as | go if needed
Step by Step Solution
There are 3 Steps involved in it
Step: 1
Get Instant Access to Expert-Tailored Solutions
See step-by-step solutions with expert insights and AI powered tools for academic success
Step: 2
Step: 3
Ace Your Homework with AI
Get the answers you need in no time with our AI-driven, step-by-step assistance