

Answered step by step
Verified Expert Solution
Question
1 Approved Answer
Hello! Picture 1 and 2 were given information, I completed picture 3 and I need help completing picture number 4, ratios. Thanks! Picture 1: Picture
Hello! Picture 1 and 2 were given information, I completed picture 3 and I need help completing picture number 4, "ratios". Thanks! 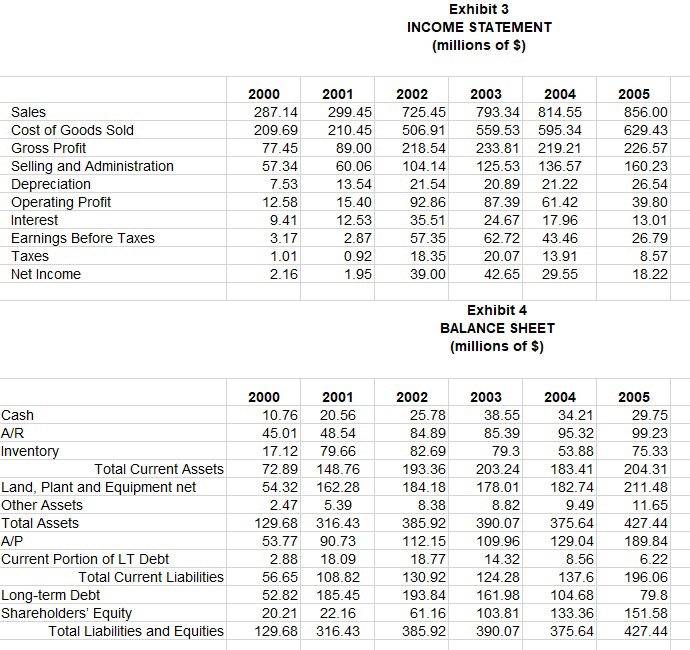
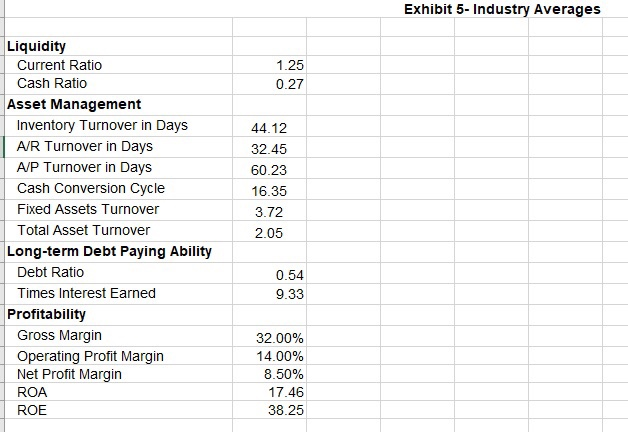
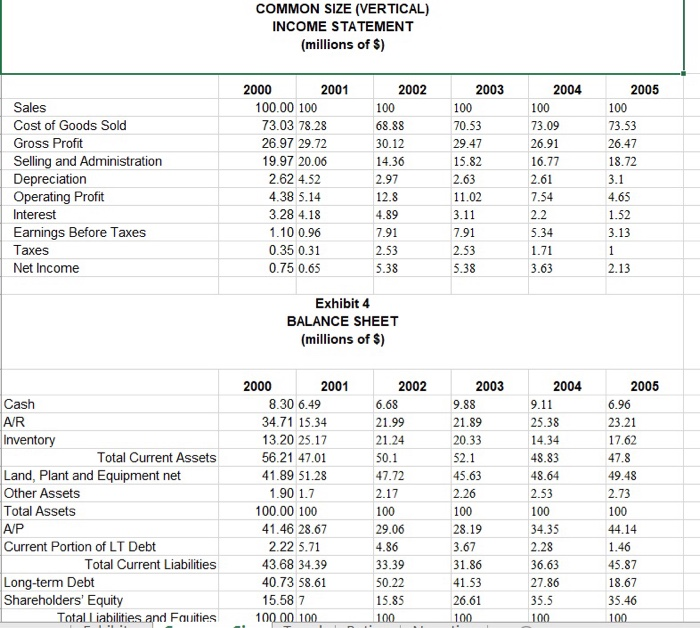
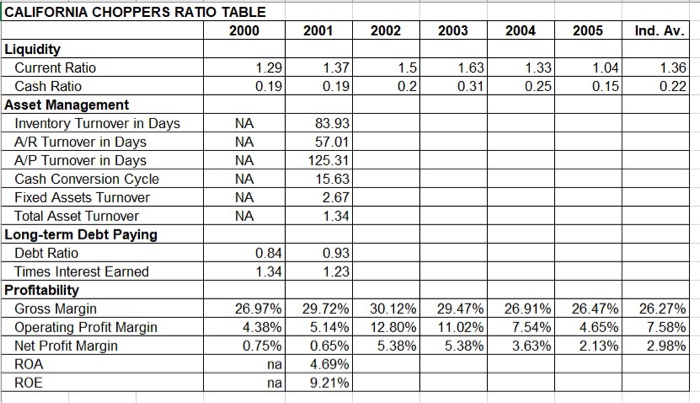
Exhibit 3 INCOME STATEMENT (millions of $) Sales Cost of Goods Sold Gross Profit Selling and Administration Depreciation Operating Profit Interest Earnings Before Taxes Taxes Net Income 2000 287.14 209.69 77.45 57.34 7.53 12.58 9.41 3.17 1.01 2.16 2001 299.45 210.45 89.00 60.06 13.54 15.40 12.53 2.87 0.92 1.95 2002 725.45 506.91 218.54 104.14 21.54 92.86 35.51 57.35 18.35 39.00 2003 2004 793.34 814.55 559.53 595.34 233.81 219.21 125.53 136.57 20.89 21.22 87.39 61.42 24.67 17.96 62.72 43.46 20.07 13.91 42.65 29.55 2005 856.00 629.43 226.57 160.23 26.54 39.80 13.01 26.79 8.57 18.22 Exhibit 4 BALANCE SHEET (millions of $) Cash A/R Inventory Total Current Assets Land, Plant and Equipment net Other Assets Total Assets 2000 2001 10.76 20.56 45.01 48.54 17.12 79.66 72.89 148.76 54.32 162.28 2.47 5.39 129.68 316.43 53.77 90.73 2.88 18.09 56.65 108.82 52.82 185.45 20.21 22.16 129.68 316.43 2002 25.78 84.89 82.69 193.36 184.18 8.38 385.92 112.15 18.77 130.92 193.84 61.16 385.92 2003 2004 38.55 34.21 85.39 95.32 79.3 53.88 203.24 183.41 178.01 182.74 8.829.49 390.07 375.64 109.96 129.04 14.32 8.56 124.28 137.6 161.98 104.68 103.81 133.36 390.07 375.64 2005 29.75 99.23 75.33 204.31 211.48 11.65 427.44 189.84 6.22 196.06 79.8 151.58 427.44 A/P Current Portion of LT Debt Total Current Liabilities Long-term Debt Shareholders' Equity Total Liabilities and Equities OG Exhibit 5- Industry Averages 1.25 0.27 Liquidity Current Ratio Cash Ratio Asset Management Inventory Turnover in Days A/R Turnover in Days A/P Turnover in Days Cash Conversion Cycle Fixed Assets Turnover Total Asset Turnover Long-term Debt Paying Ability Debt Ratio Times Interest Earned Profitability Gross Margin Operating Profit Margin Net Profit Margin ROA ROE 44.12 32.45 60.23 16.35 3.72 2.05 0.54 9.33 32.00% 14.00% 8.50% 17.46 38.25 COMMON SIZE (VERTICAL) INCOME STATEMENT (millions of $) Sales Cost of Goods Sold Gross Profit Selling and Administration Depreciation Operating Profit Interest Earnings Before Taxes Taxes Net Income 2000 2001 100.00 100 73.03 78.28 26.97 29.72 19.97 20.06 2.62 4.52 4.38 5.14 3.28 4.18 1.10 0.96 0.35 0.31 0.75 0.65 2002 100 68.88 30.12 14.36 2.97 12.8 4.89 7.91 2.53 5.38 2003 100 70.53 29.47 15.82 2.63 11.02 3.11 7.91 2.53 5.38 2004 100 73.09 26.91 16.77 2.61 7.54 2.2 5.34 1.71 3.63 2005 100 73.53 26.47 18.72 3.1 4.65 1.52 3.13 2.13 Exhibit 4 BALANCE SHEET (millions of $) Cash AR Inventory Total Current Assets Land, Plant and Equipment net Other Assets Total Assets A/P Current Portion of LT Debt Total Current Liabilities Long-term Debt Shareholders' Equity Total liabilities and Fauities 2000 2001 8.30 6.49 34.71 15.34 13.20 25.17 56.21 47.01 41.89 51.28 1.90 1.7 100.00 100 41.46 28.67 2.22 5.71 43.68 34.39 40.73 58.61 15.58 7 100.00 100 2002 6.68 21.99 21.24 50.1 47.72 2.17 100 29.06 4.86 33.39 50.22 15.85 2003 9.88 21.89 20.33 52.1 45.63 2.26 100 28.19 3.67 31.86 41.53 26.61 100 2004 9.11 25.38 14 34 48.83 48.64 2.53 100 34.35 2.28 36.63 27.86 35.5 100 2005 6.96 23.21 17.62 47.8 49.48 2.73 100 44.14 1.46 45.87 18.67 35.46 100 100 2002 2003 2004 2005 Ind. Av. 1.5 0.2 1.631.33 0.31 0.25 1.041.36 0.15 0.22 NA CALIFORNIA CHOPPERS RATIO TABLE 2000 2001 Liquidity Current Ratio 1.291.37 Cash Ratio 0.19 0.19 Asset Management Inventory Turnover in Days NA 83.93 A/R Turnover in Days 57.01 A/P Turnover in Days NA 125.31 Cash Conversion Cycle NA 15.63 Fixed Assets Turnover NA 2.67 Total Asset Turnover NA 1.34 Long-term Debt Paying Debt Ratio 0.93 Times Interest Earned 1.34 1.23 Profitability Gross Margin 26.97% 29.72% Operating Profit Margin 4.38% 5.14% Net Profit Margin 0.75% 0.65% ROA na 4.69% ROE na 9.21% 30.12% 12.80% 5.38% 29.47% 11.02% 5.38% 26.91% 7.54% 3.63% 26.47% 4.65% 2.13% 26.27% 7.58% 2.98% Picture 1:
Picture 2:
Picture 3:
Picture 4 (the one I need help with):
Step by Step Solution
There are 3 Steps involved in it
Step: 1

Get Instant Access to Expert-Tailored Solutions
See step-by-step solutions with expert insights and AI powered tools for academic success
Step: 2

Step: 3
Ace Your Homework with AI
Get the answers you need in no time with our AI-driven, step-by-step assistance
Get Started
Options Trading For Beginners How To Generate Predictable Income And Make A Living Without Taking Big Risks Even If You Re A Complete Beginner
Authors: Greg Middleton
1st Edition
979-8866955046