

Answered step by step
Verified Expert Solution
Question
1 Approved Answer
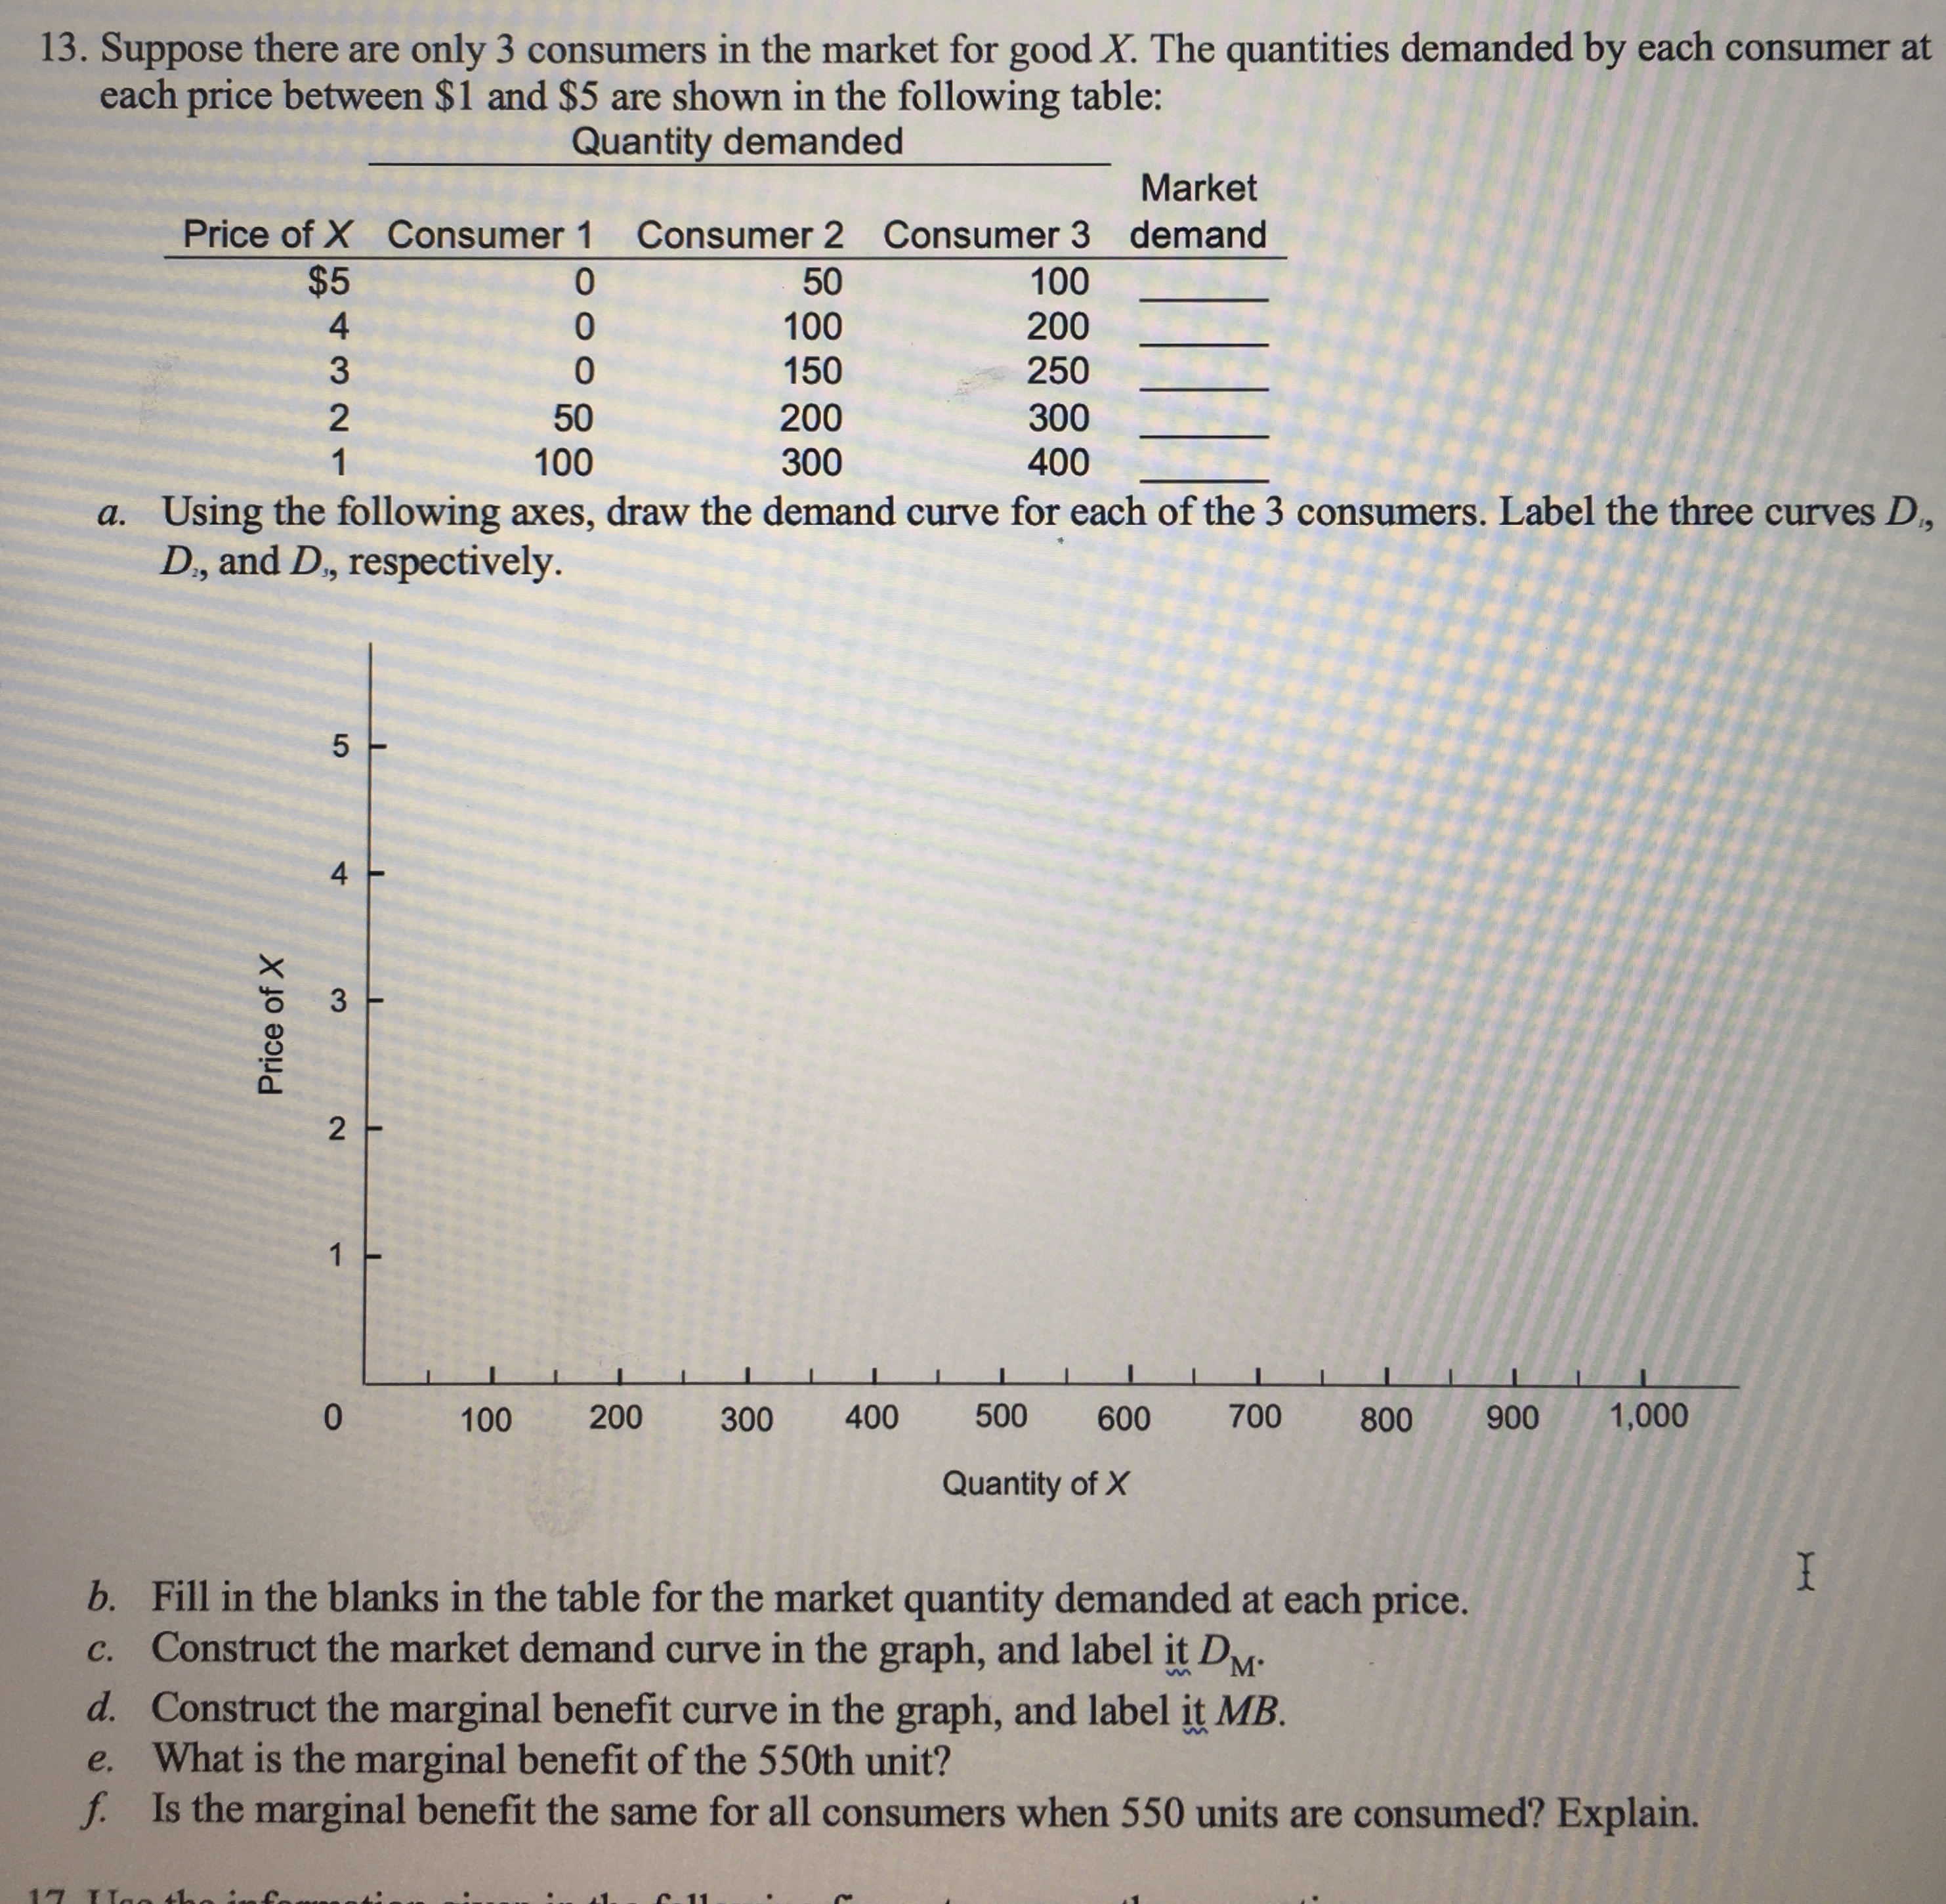
Hello. Please explain the solutions for this question. Also, please, explain how can to construct the curves using Excel. Thank you very much! 13. Suppose
Hello. Please explain the solutions for this question. Also, please, explain how can to construct the curves using Excel. Thank you very much!
Step by Step Solution
There are 3 Steps involved in it
Step: 1

Get Instant Access to Expert-Tailored Solutions
See step-by-step solutions with expert insights and AI powered tools for academic success
Step: 2

Step: 3
Ace Your Homework with AI
Get the answers you need in no time with our AI-driven, step-by-step assistance
Get Started
International Economics Theory and Policy
Authors: Paul R. Krugman, Maurice Obstfeld, Marc J. Melitz
9th Edition
978-0132146654, 0132146657, 9780273754091, 978-0273754206