Hello please help me identify the correct answers to these questions . I gave them several tries but got them incorrect
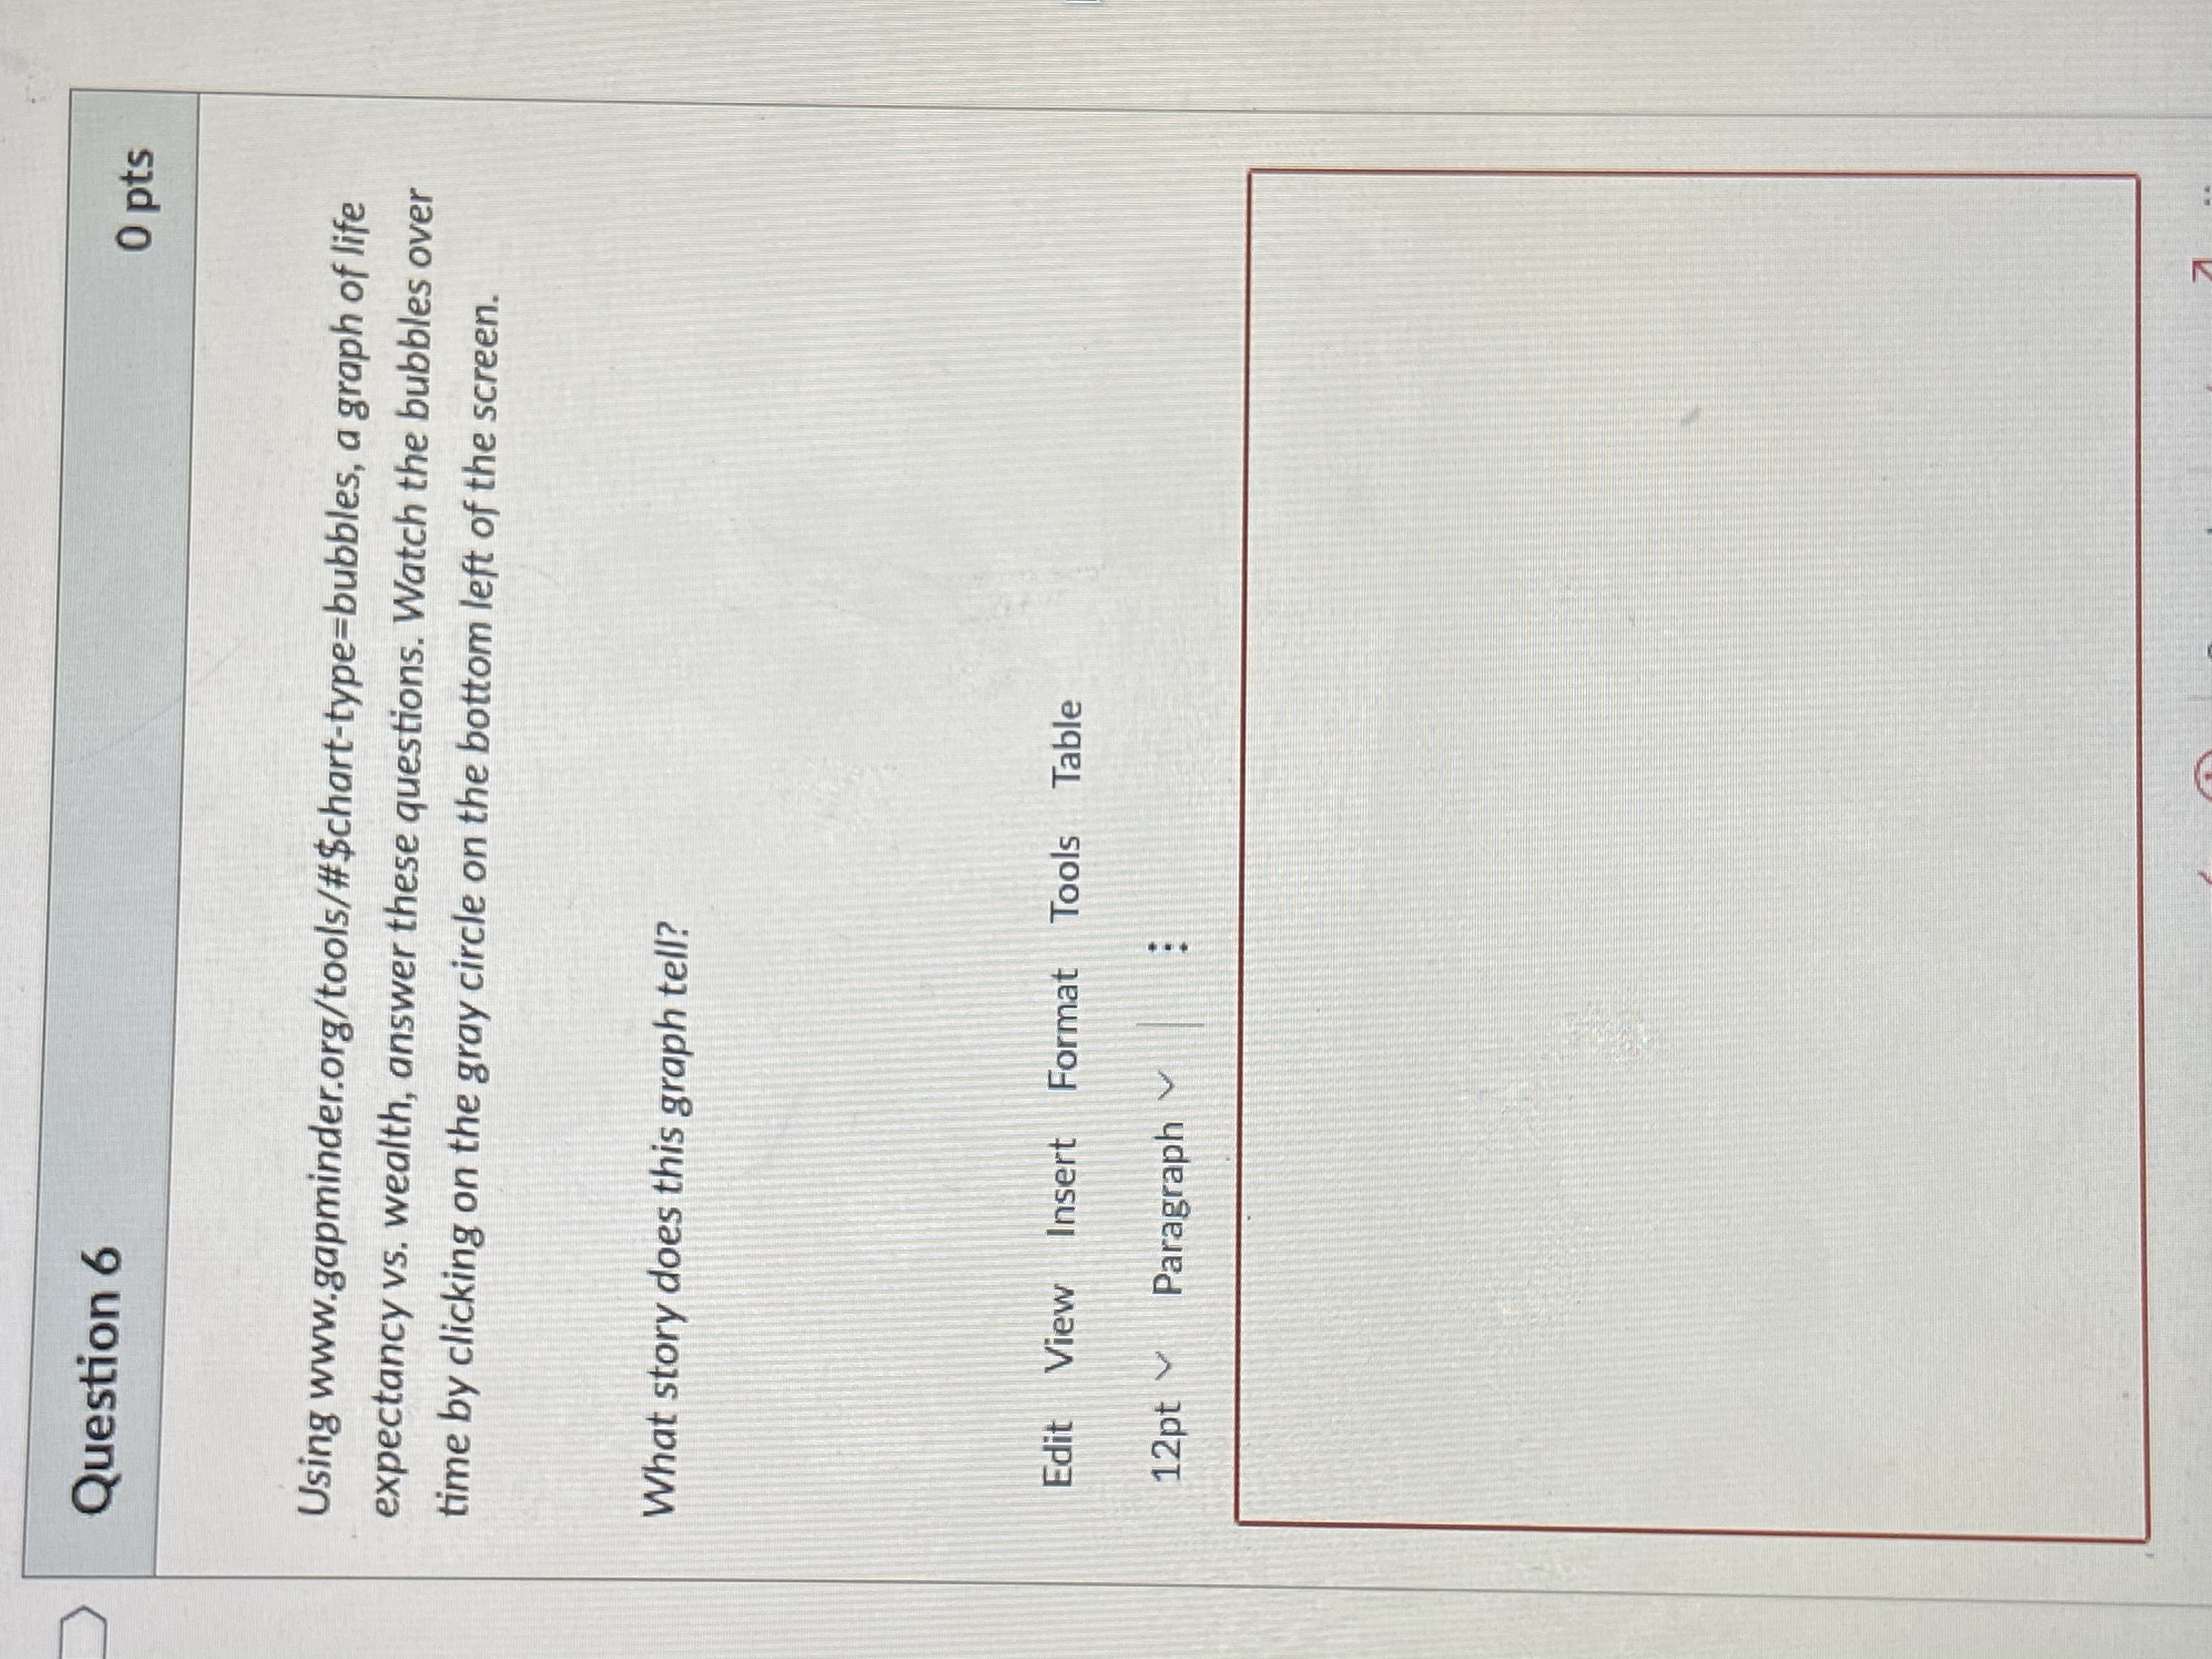
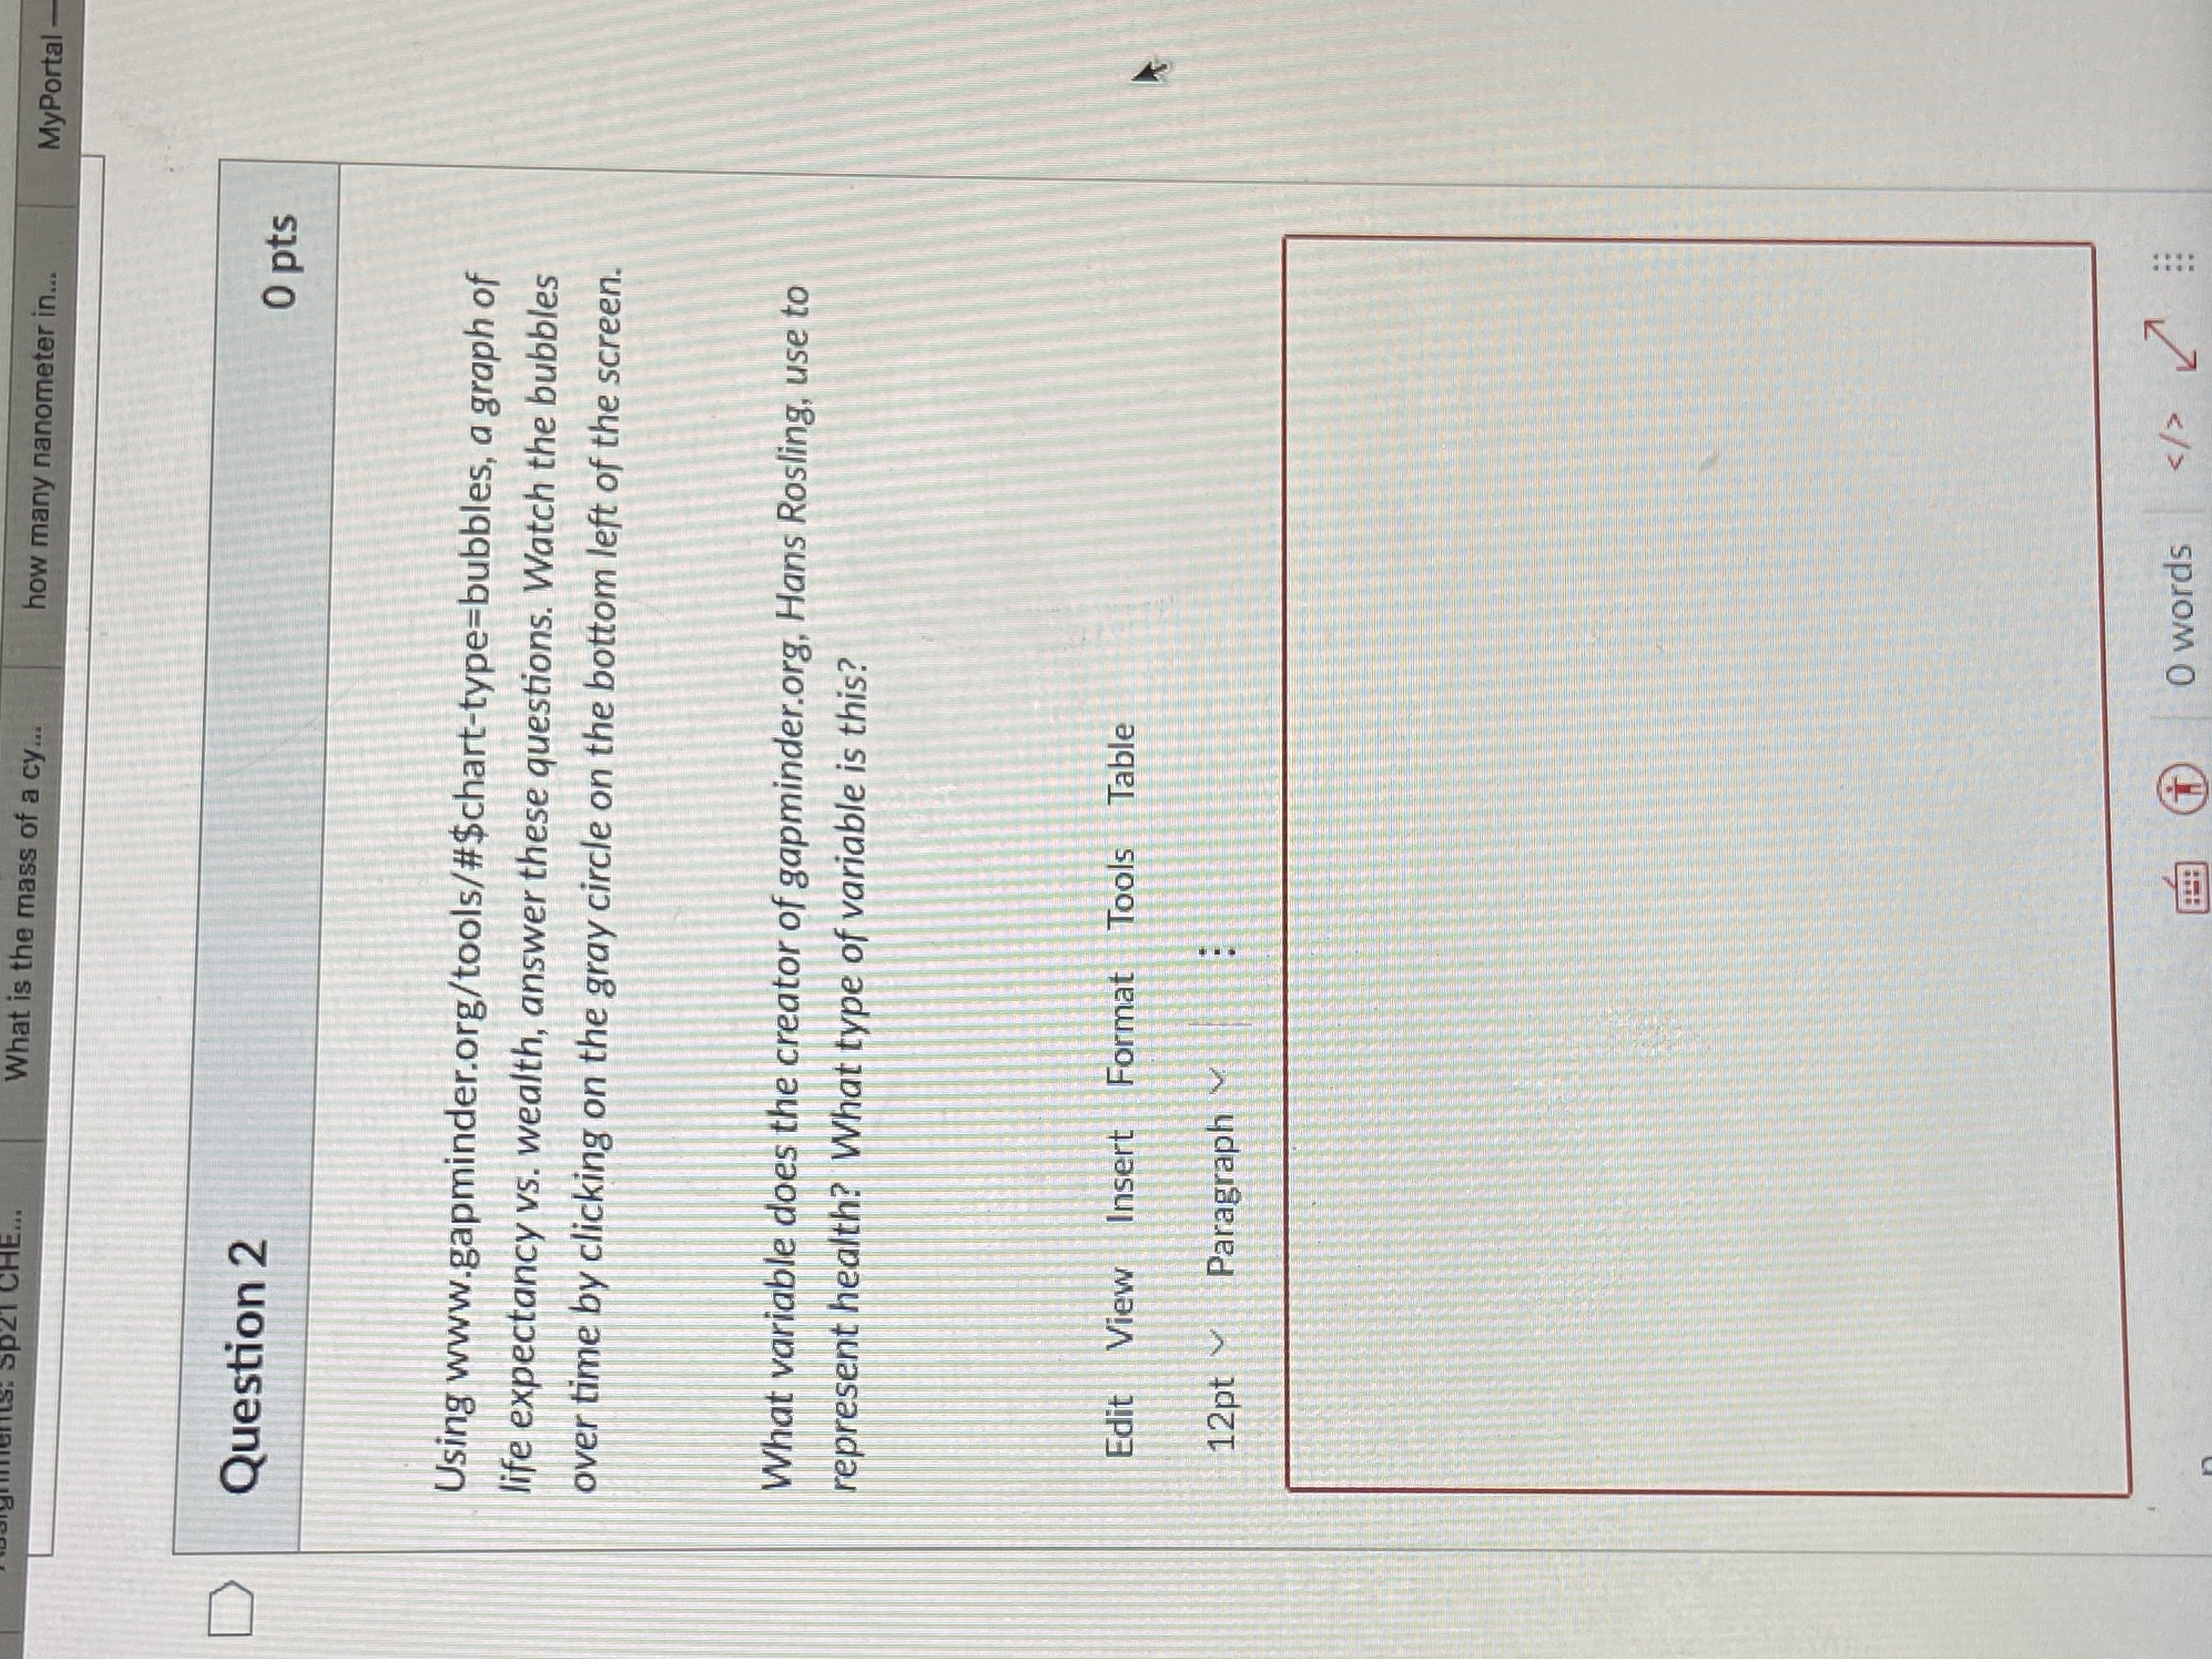
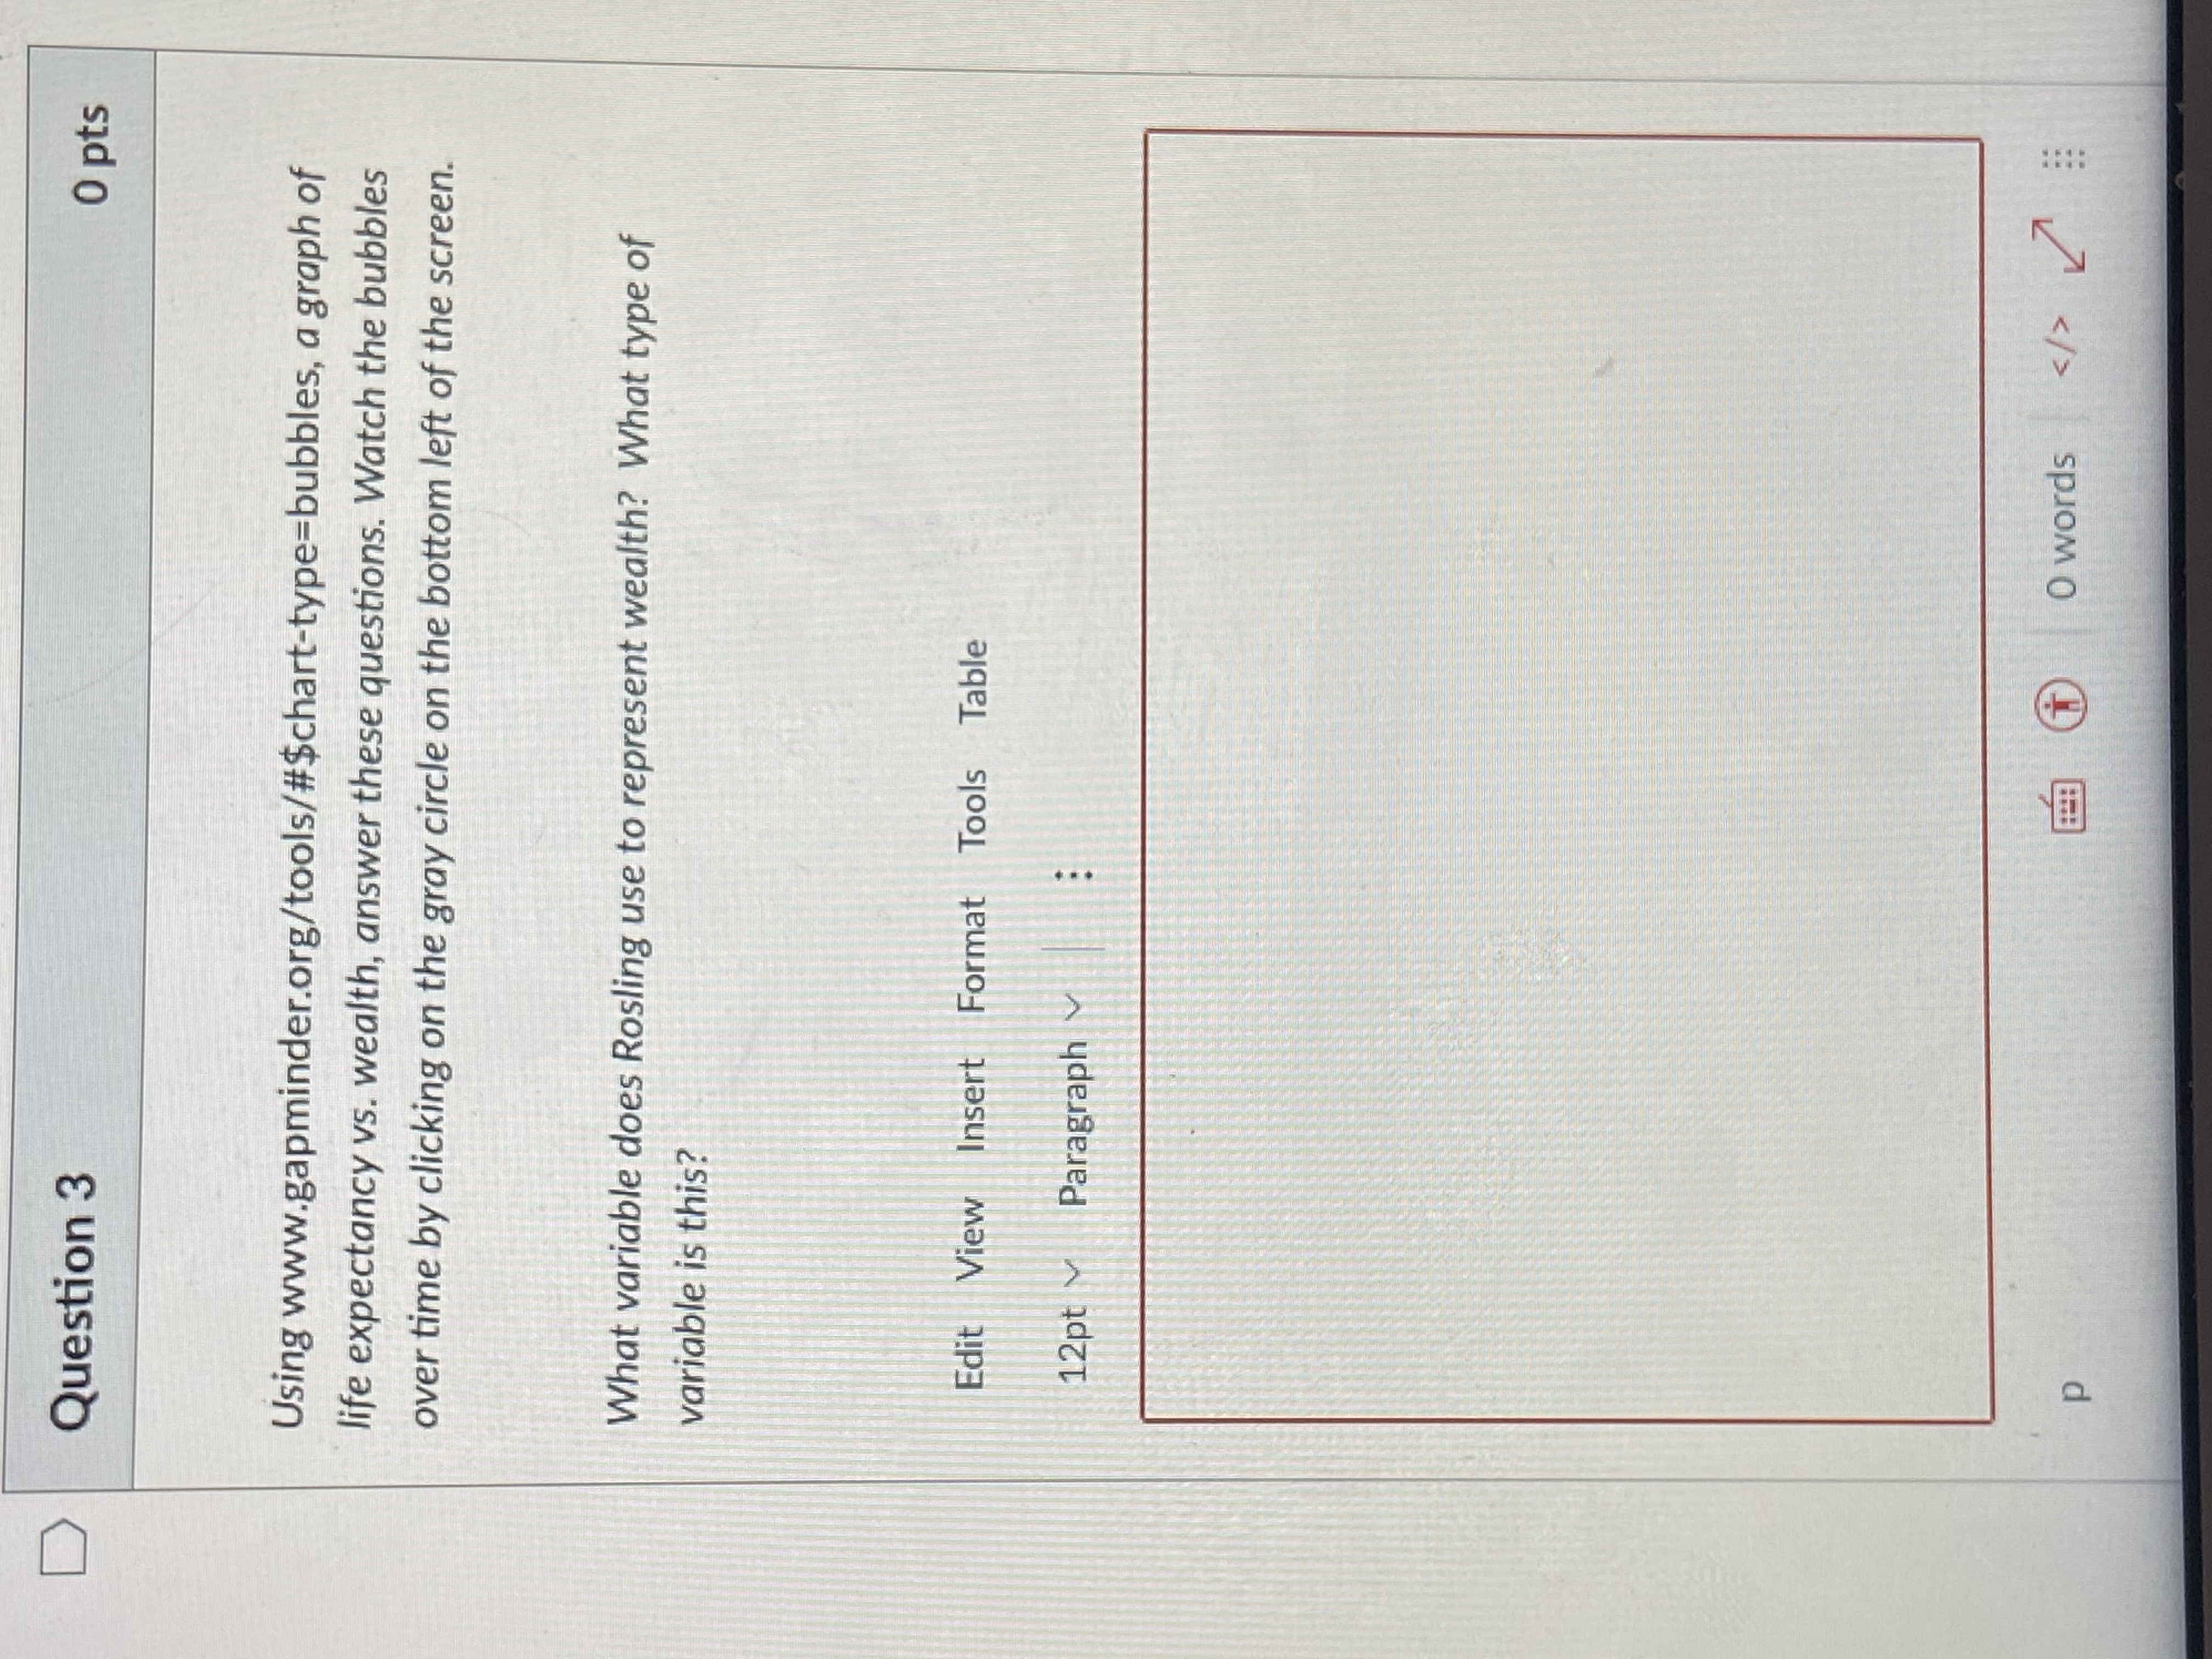
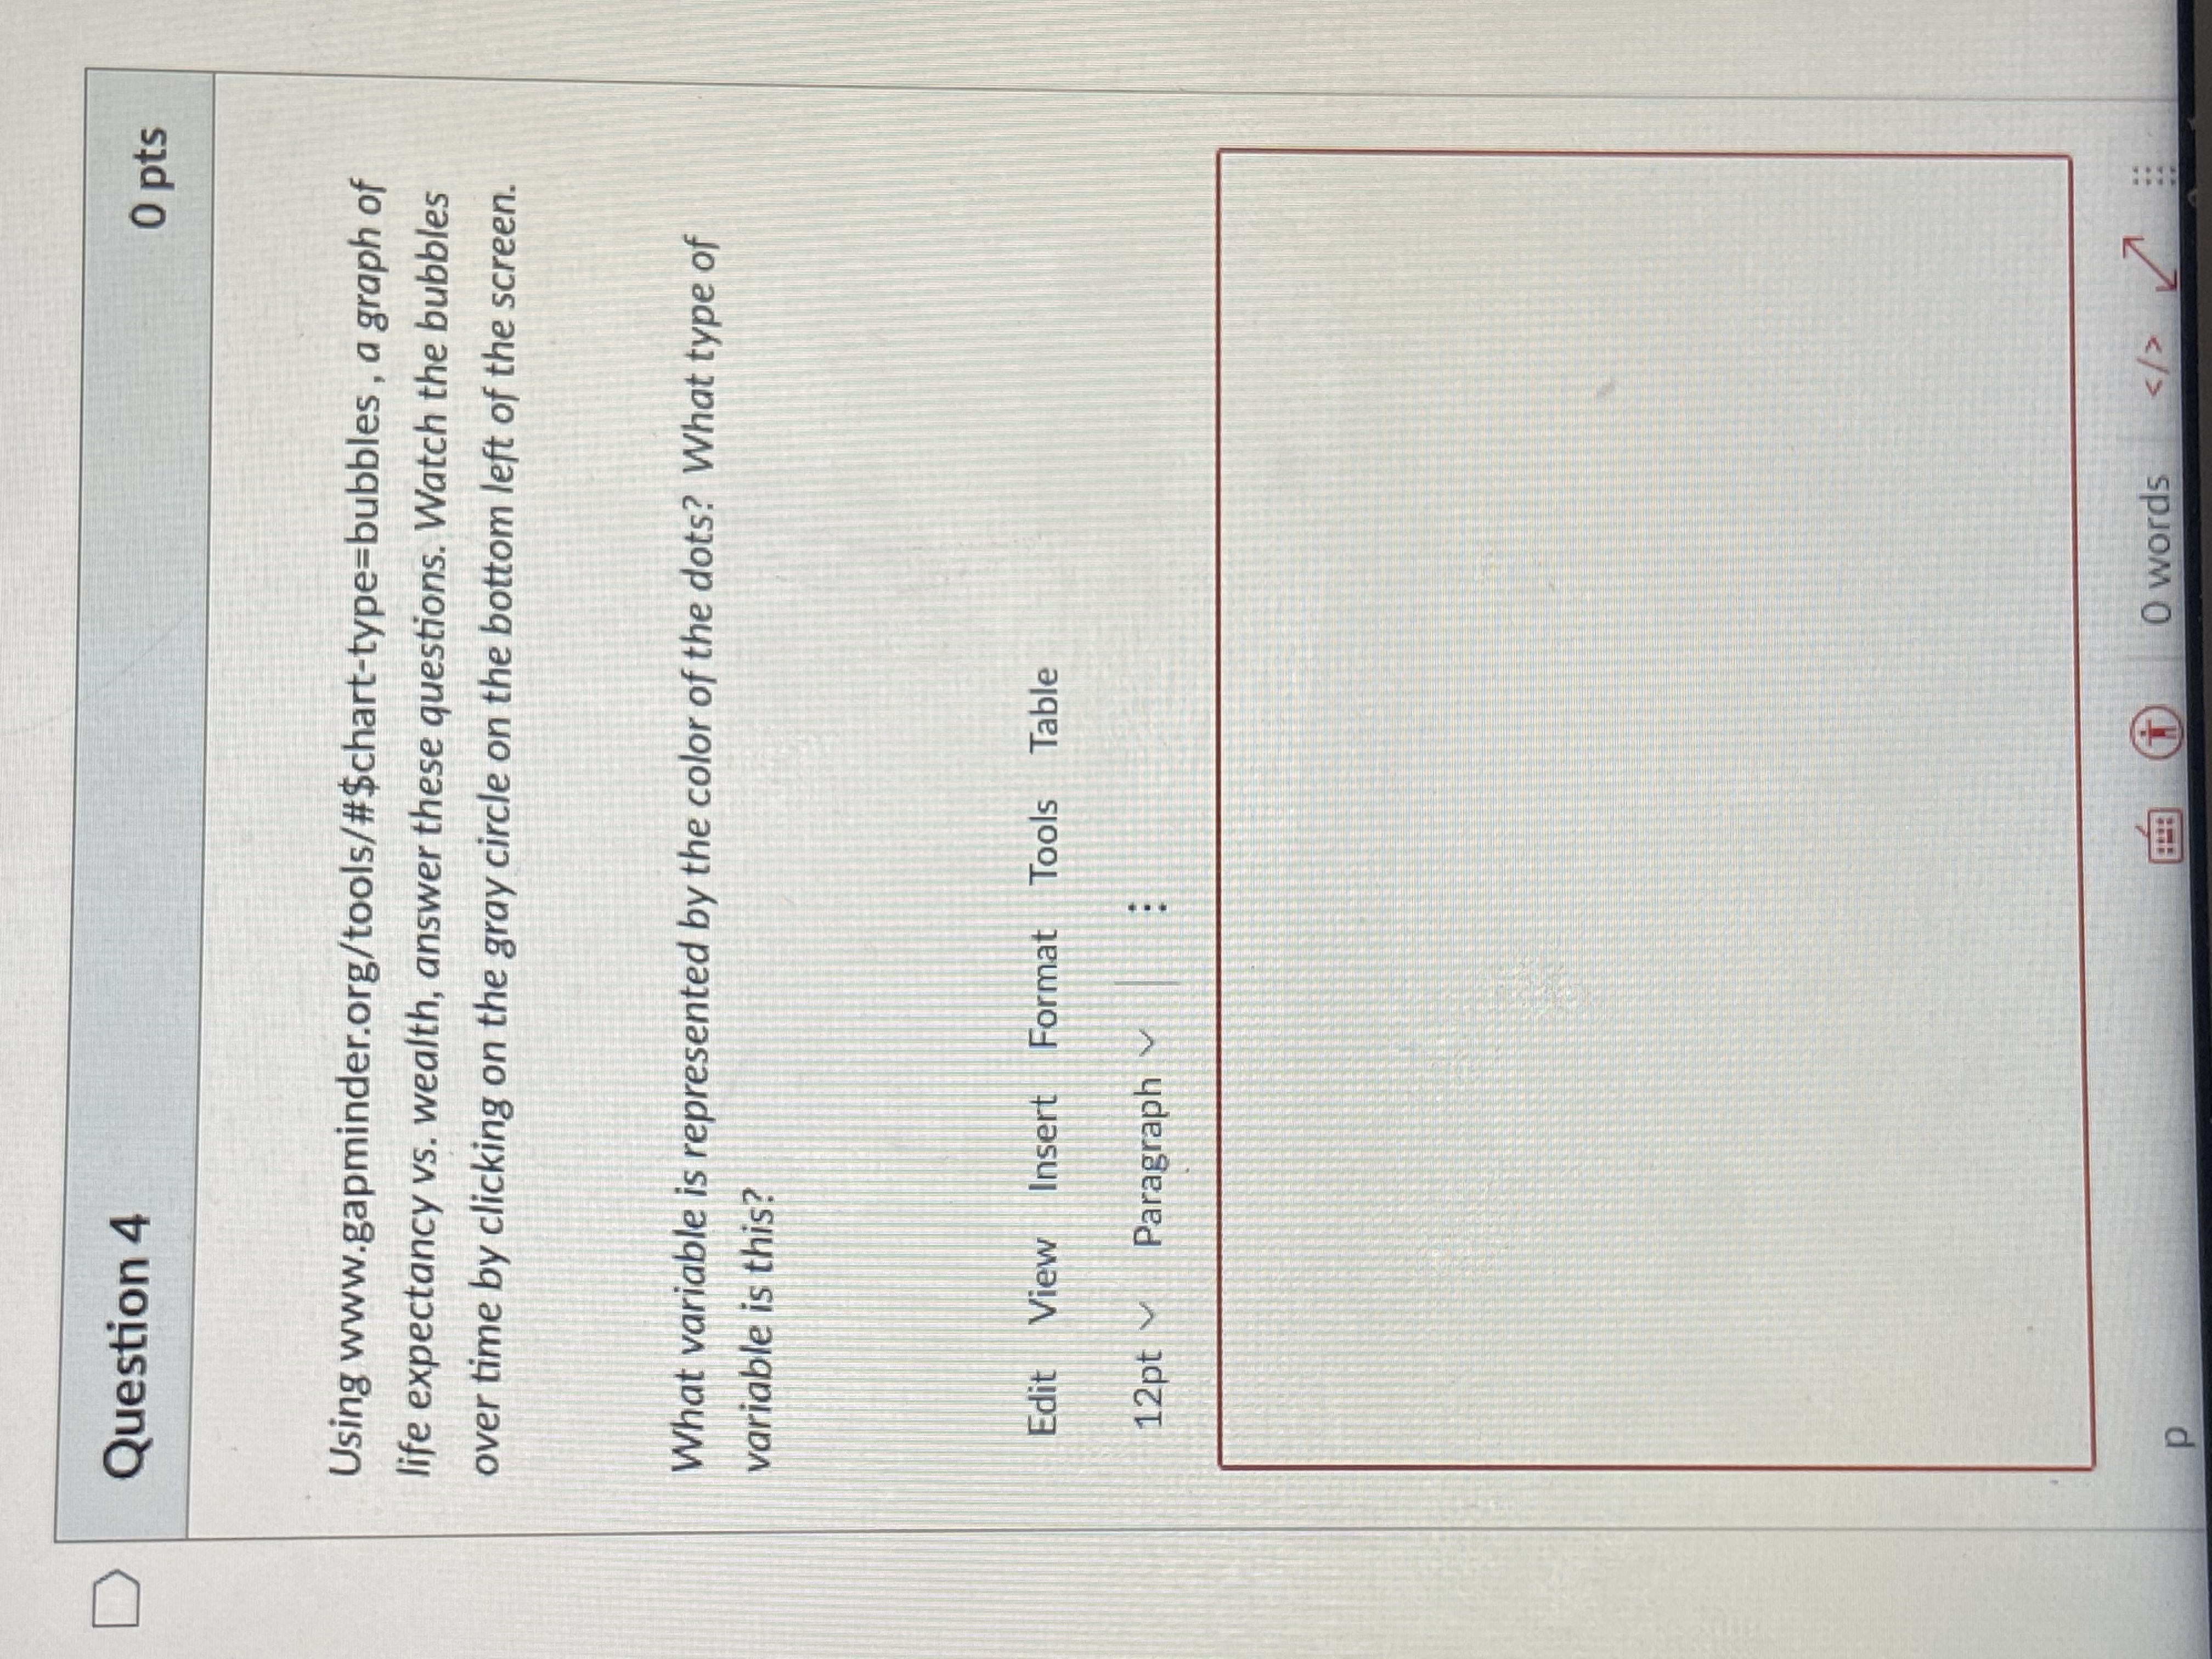
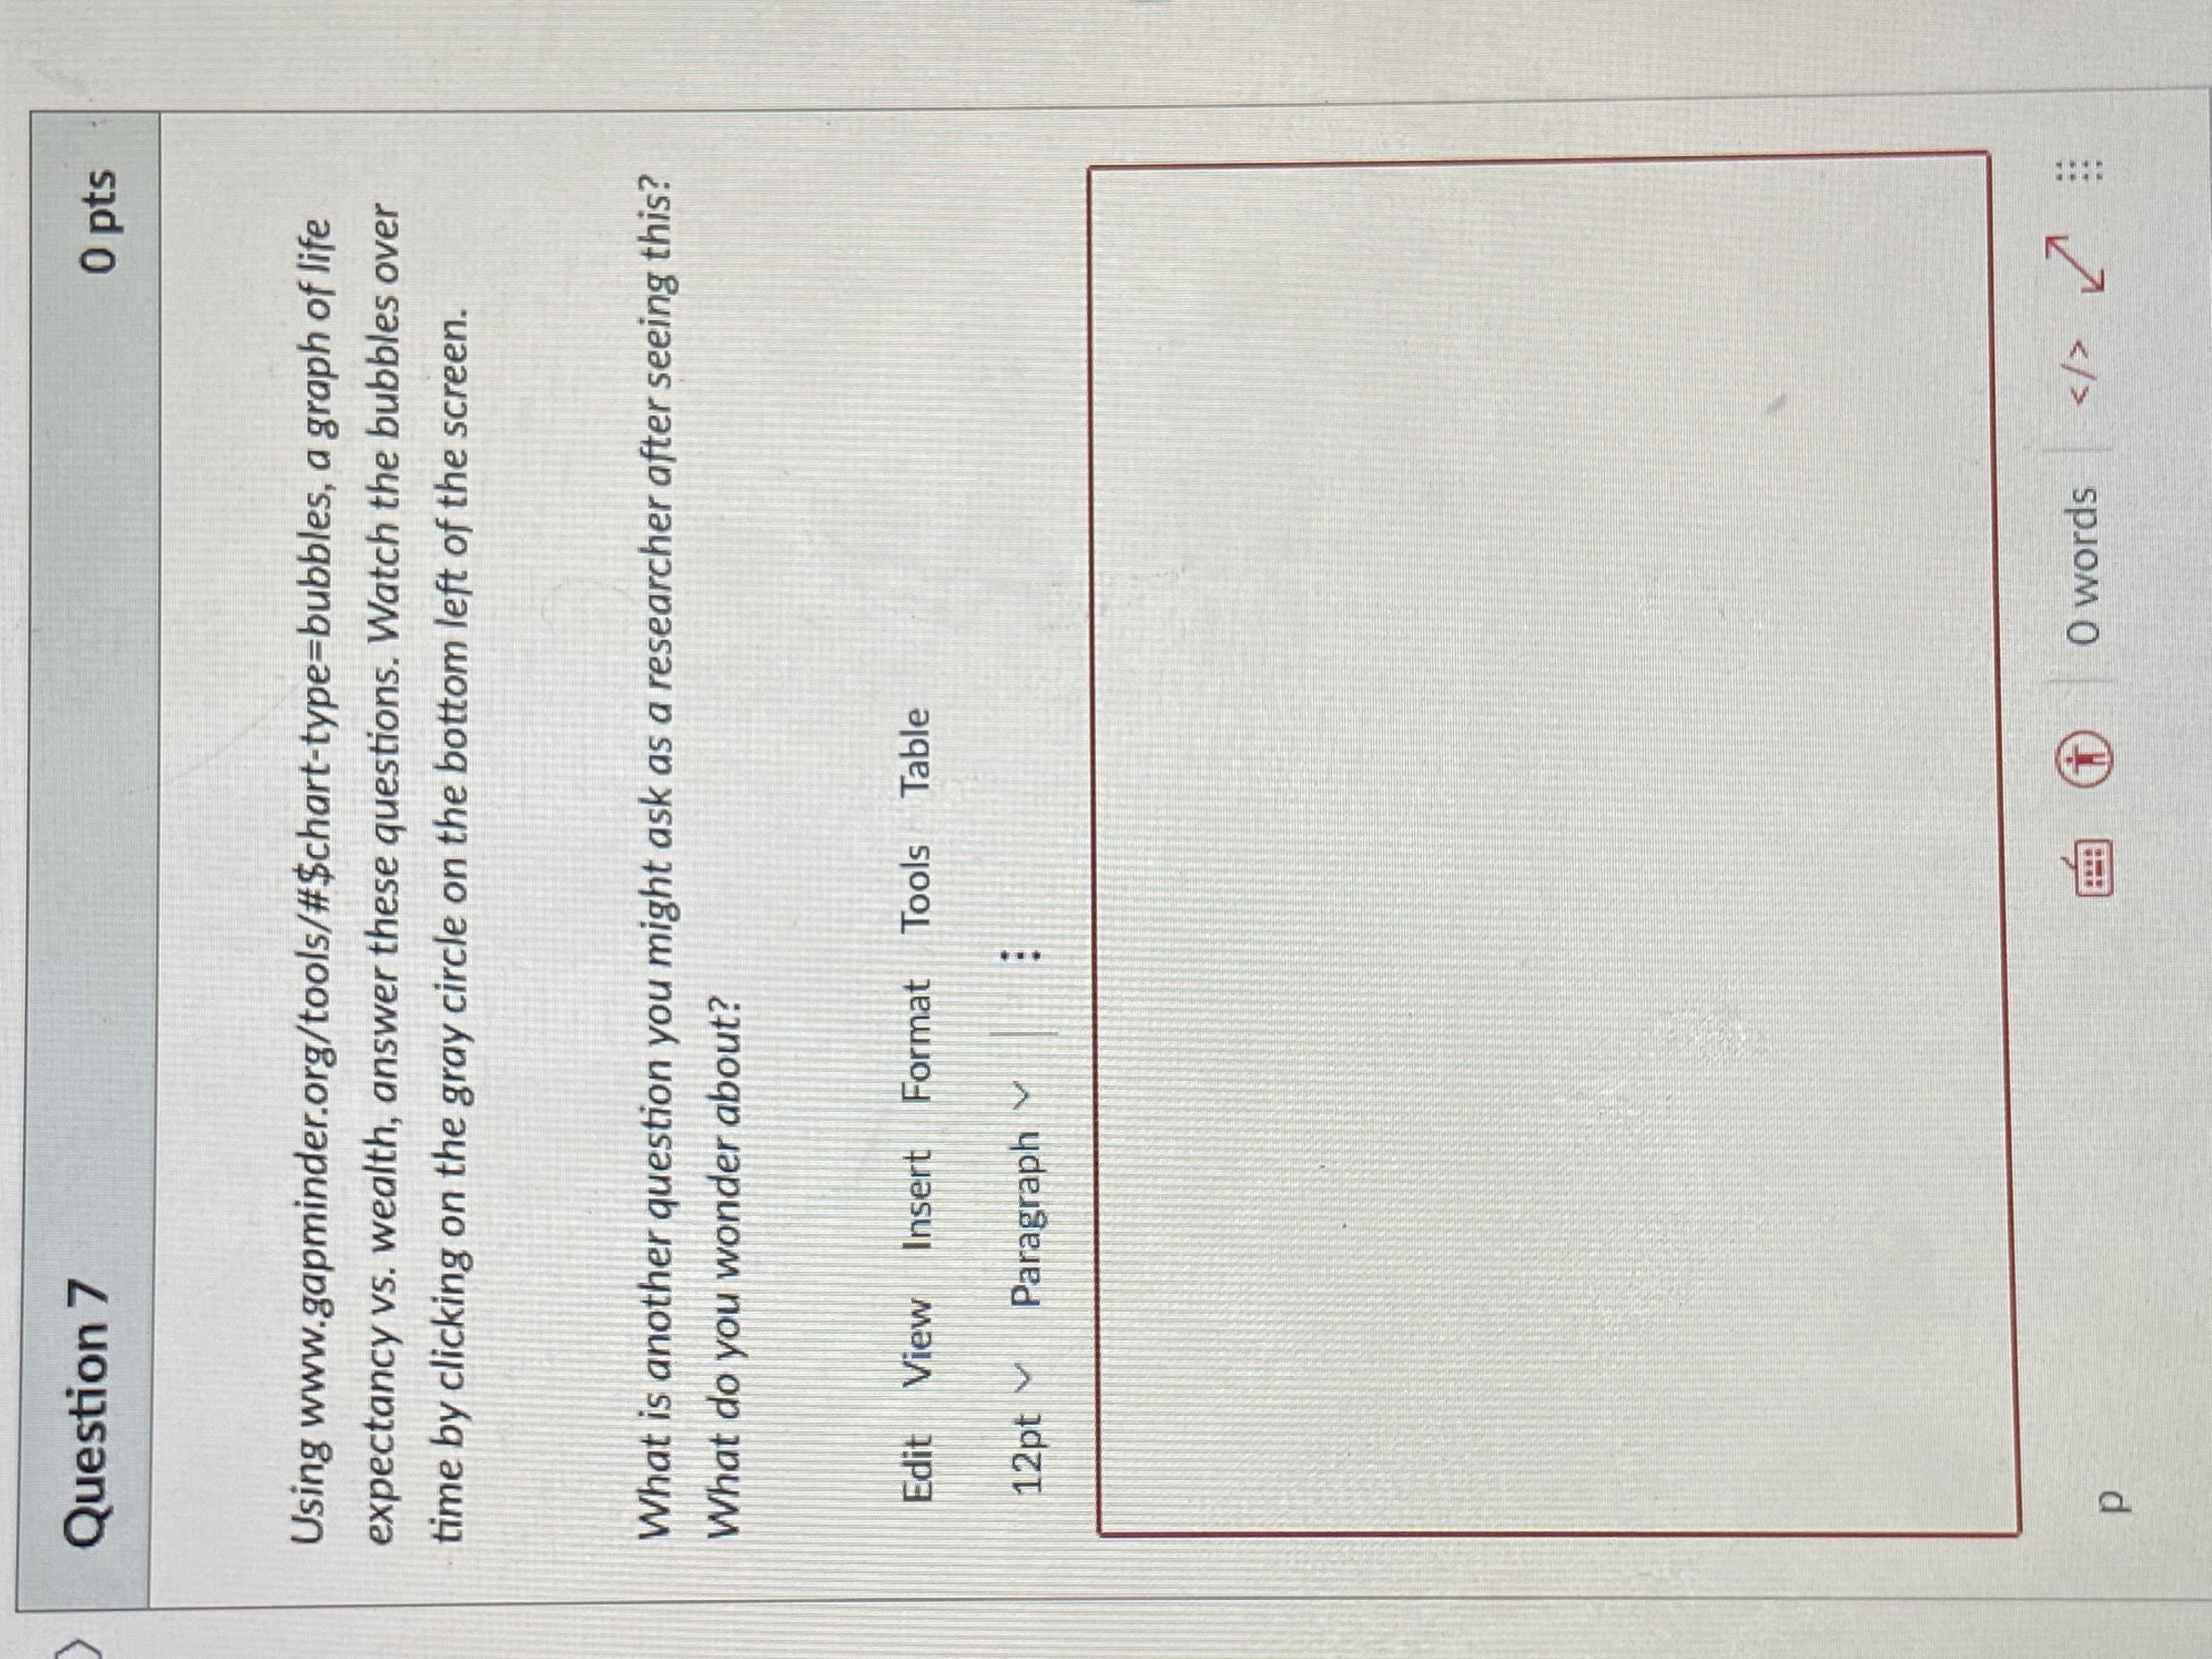
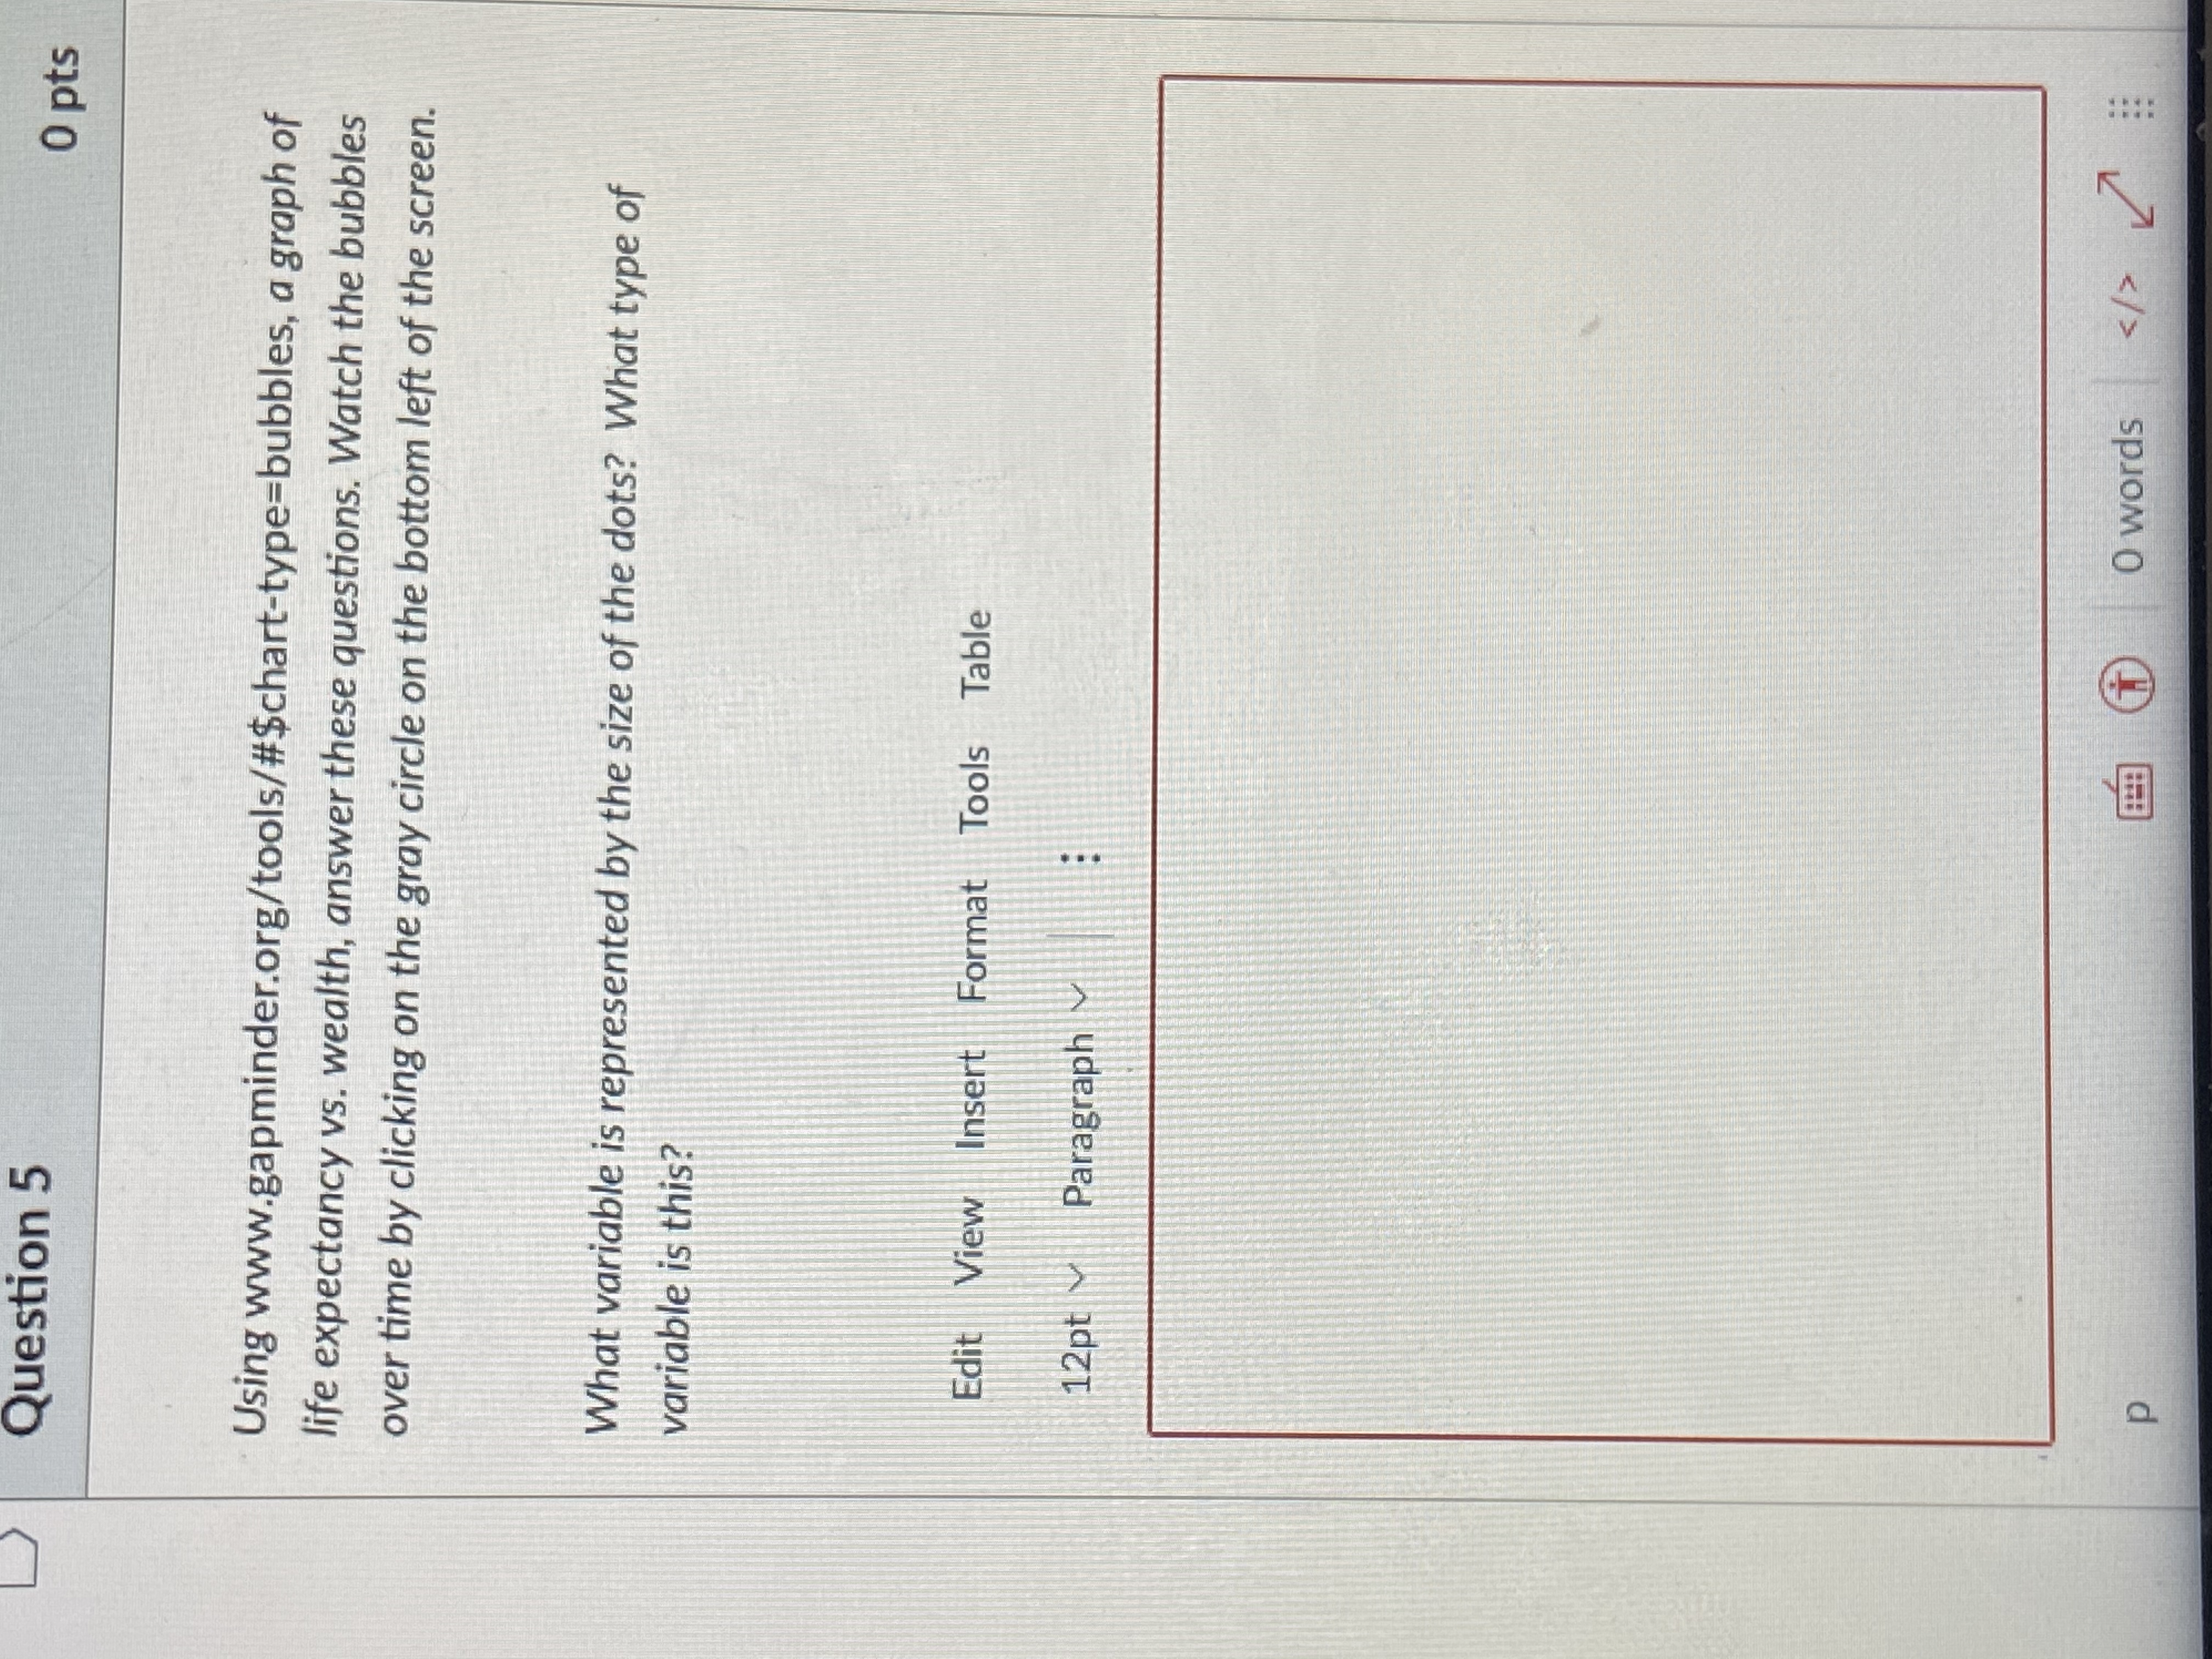
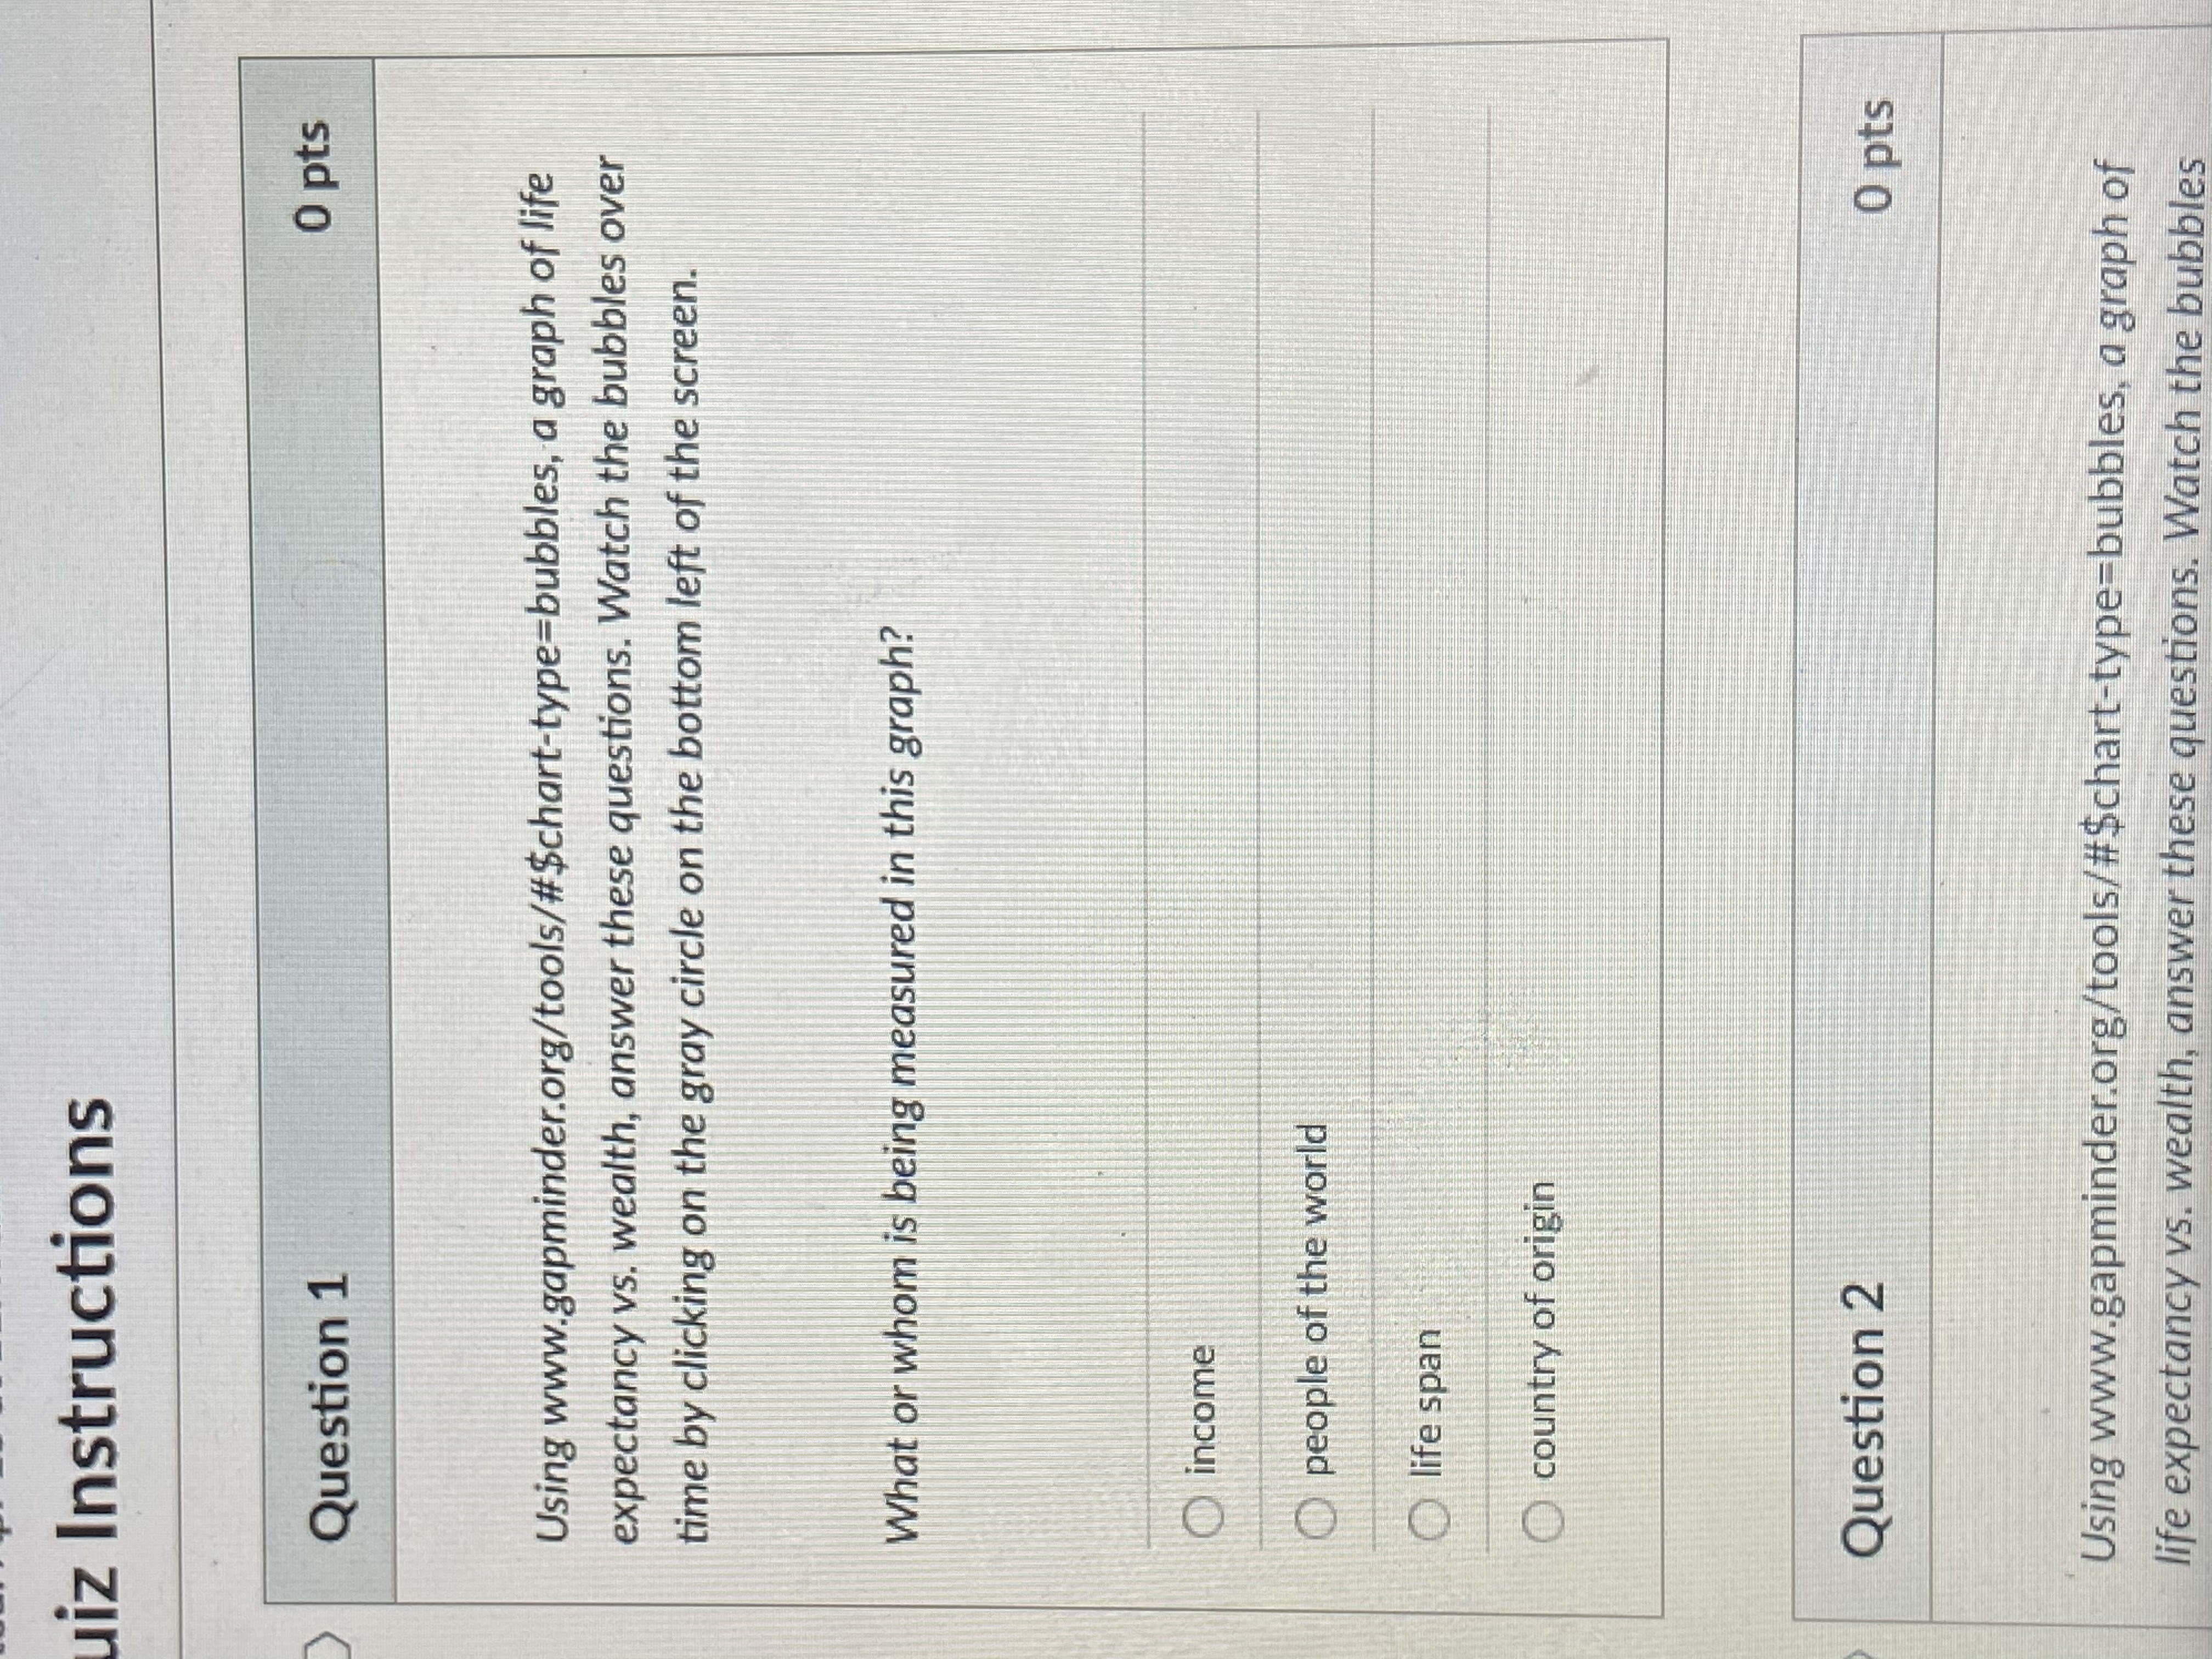
Question 6 0 pts Using www.gapminder.org/tools/#$chart-type=bubbles, a graph of life expectancy vs. wealth, answer these questions. Watch the bubbles over time by clicking on the gray circle on the bottom left of the screen. What story does this graph tell? Edit View Insert Format Tools Table 12pt Y ParagraphHE... What is the mass of a cy... how many nanometer in.. MyPortal - Question 2 0 pts Using www.gapminder.org/tools/#$chart-type=bubbles, a graph of life expectancy vs. wealth, answer these questions. Watch the bubbles over time by clicking on the gray circle on the bottom left of the screen. What variable does the creator of gapminder.org, Hans Rosling, use to represent health? What type of variable is this? Edit View Insert Format Tools Table 12pt ~ Paragraph 0 words > : : :;D Question 3 0 pts Using www.gapminder.org/tools/#$chart-type=bubbles, a graph of life expectancy vs. wealth, answer these questions. Watch the bubbles over time by clicking on the gray circle on the bottom left of the screen. What variable does Rosling use to represent wealth? What type of variable is this? Edit View Insert Format Tools Table 12pt ~ Paragraph P 0 words >D Question 4 0 pts Using www.gapminder.org/tools/#$chart-type=bubbles , a graph of life expectancy vs. wealth, answer these questions. Watch the bubbles over time by clicking on the gray circle on the bottom left of the screen. What variable is represented by the color of the dots? What type of variable is this? Edit View Insert Format Tools Table 12pt Paragraph 0 words PQuestion 7 0 pts Using www.gapminder.org/tools/#$chart-type=bubbles, a graph of life expectancy vs. wealth, answer these questions. Watch the bubbles over time by clicking on the gray circle on the bottom left of the screen. What is another question you might ask as a researcher after seeing this? What do you wonder about? Edit View Insert Format Tools Table 12pt ~ Paragraph 0 words > PQuestion 5 0 pts Using www.gapminder.org/tools/#$chart-type=bubbles, a graph of life expectancy vs. wealth, answer these questions. Watch the bubbles over time by clicking on the gray circle on the bottom left of the screen. What variable is represented by the size of the dots? What type of variable is this? Edit View Insert Format Tools Table 12pt Paragraph P O words >iz Instructions Question 1 0 pts Using www.gapminder.org/tools/#$chart-type=bubbles, a graph of life expectancy vs. wealth, answer these questions. Watch the bubbles over time by clicking on the gray circle on the bottom left of the screen. What or whom is being measured in this graph? income people of the world O life span country of origin Question 2 0 pts Using www.gapminder.org/tools/#$chart-type=bubbles, a graph of life expectancy vs. wealth, answer these questions. Watch the bubbles
