

Answered step by step
Verified Expert Solution
Question
1 Approved Answer
Hello, please help with questions 3 and 4. Please answer quickly! Will upvote answer thanks 1. Language that will be used 2. Implementation plan discussion
Hello, please help with questions 3 and 4. Please answer quickly! Will upvote answer thanks
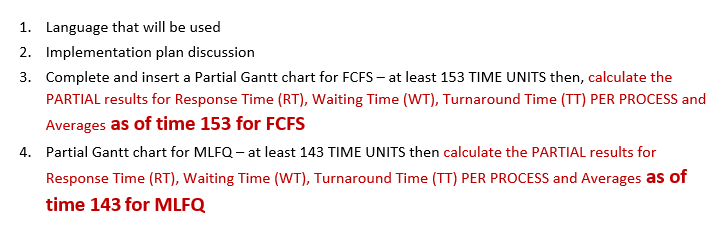
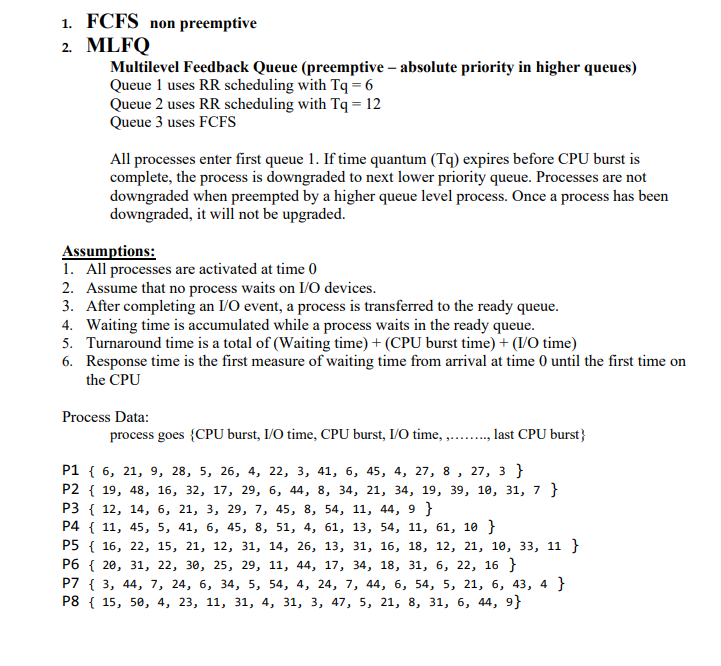
1. Language that will be used 2. Implementation plan discussion 3. Complete and insert a Partial Gantt chart for FCFS - at least 153 TIME UNITS then, calculate the PARTIAL results for Response Time (RT), Waiting Time (WT), Turnaround Time (TT) PER PROCESS and Averages as of time 153 for FCFS 4. Partial Gantt chart for MLFQ- at least 143 TIME UNITS then calculate the PARTIAL results for Response Time (RT), Waiting Time (WT), Turnaround Time (TT) PER PROCESS and Averages as of time 143 for MLFQ 1. FCFS non preemptive 2. MLFQ Multilevel Feedback Queue (preemptive absolute priority in higher queues) Queue 1 uses RR scheduling with Tq = 6 Queue 2 uses RR scheduling with Tq = 12 Queue 3 uses FCFS All processes enter first queue 1. If time quantum (Tq) expires before CPU burst is complete, the process is downgraded to next lower priority queue. Processes are not downgraded when preempted by a higher queue level process. Once a process has been downgraded, it will not be upgraded. Assumptions: 1. All processes are activated at time 0 2. Assume that no process waits on I/O devices. 3. After completing an 1/0 event, a process is transferred to the ready queue. 4. Waiting time is accumulated while a process waits in the ready queue. 5. Turnaround time is a total of (Waiting time) +(CPU burst time) + (I/O time) 6. Response time is the first measure of waiting time from arrival at time 0 until the first time on the CPU Process Data: process goes {CPU burst, I/O time, CPU burst, 1/0 time, ........., last CPU burst} P1 { 6, 21, 9, 28, 5, 26, 4, 22, 3, 41, 6, 45, 4, 27, 8 , 27, 3} P2 { 19, 48, 16, 32, 17, 29, 6, 44, 8, 34, 21, 34, 19, 39, 10, 31, 7 } P3 { 12, 14, 6, 21, 3, 29, 7, 45, 8, 54, 11, 44, 9 } P4 { 11, 45, 5, 41, 6, 45, 8, 51, 4, 61, 13, 54, 11, 61, 10 } P5 { 16, 22, 15, 21, 12, 31, 14, 26, 13, 31, 16, 18, 12, 21, 10, 33, 11 } P6 { 20, 31, 22, 30, 25, 29, 11, 44, 17, 34, 18, 31, 6, 22, 16 } P7 { 3, 44, 7, 24, 6, 34, 5, 54, 4, 24, 7, 44, 6, 54, 5, 21, 6, 43, 4 } P8 { 15, 50, 4, 23, 11, 31, 4, 31, 3, 47, 5, 21, 8, 31, 6, 44, 9} 1. Language that will be used 2. Implementation plan discussion 3. Complete and insert a Partial Gantt chart for FCFS - at least 153 TIME UNITS then, calculate the PARTIAL results for Response Time (RT), Waiting Time (WT), Turnaround Time (TT) PER PROCESS and Averages as of time 153 for FCFS 4. Partial Gantt chart for MLFQ- at least 143 TIME UNITS then calculate the PARTIAL results for Response Time (RT), Waiting Time (WT), Turnaround Time (TT) PER PROCESS and Averages as of time 143 for MLFQ 1. FCFS non preemptive 2. MLFQ Multilevel Feedback Queue (preemptive absolute priority in higher queues) Queue 1 uses RR scheduling with Tq = 6 Queue 2 uses RR scheduling with Tq = 12 Queue 3 uses FCFS All processes enter first queue 1. If time quantum (Tq) expires before CPU burst is complete, the process is downgraded to next lower priority queue. Processes are not downgraded when preempted by a higher queue level process. Once a process has been downgraded, it will not be upgraded. Assumptions: 1. All processes are activated at time 0 2. Assume that no process waits on I/O devices. 3. After completing an 1/0 event, a process is transferred to the ready queue. 4. Waiting time is accumulated while a process waits in the ready queue. 5. Turnaround time is a total of (Waiting time) +(CPU burst time) + (I/O time) 6. Response time is the first measure of waiting time from arrival at time 0 until the first time on the CPU Process Data: process goes {CPU burst, I/O time, CPU burst, 1/0 time, ........., last CPU burst} P1 { 6, 21, 9, 28, 5, 26, 4, 22, 3, 41, 6, 45, 4, 27, 8 , 27, 3} P2 { 19, 48, 16, 32, 17, 29, 6, 44, 8, 34, 21, 34, 19, 39, 10, 31, 7 } P3 { 12, 14, 6, 21, 3, 29, 7, 45, 8, 54, 11, 44, 9 } P4 { 11, 45, 5, 41, 6, 45, 8, 51, 4, 61, 13, 54, 11, 61, 10 } P5 { 16, 22, 15, 21, 12, 31, 14, 26, 13, 31, 16, 18, 12, 21, 10, 33, 11 } P6 { 20, 31, 22, 30, 25, 29, 11, 44, 17, 34, 18, 31, 6, 22, 16 } P7 { 3, 44, 7, 24, 6, 34, 5, 54, 4, 24, 7, 44, 6, 54, 5, 21, 6, 43, 4 } P8 { 15, 50, 4, 23, 11, 31, 4, 31, 3, 47, 5, 21, 8, 31, 6, 44, 9}
Step by Step Solution
There are 3 Steps involved in it
Step: 1

Get Instant Access to Expert-Tailored Solutions
See step-by-step solutions with expert insights and AI powered tools for academic success
Step: 2

Step: 3
Ace Your Homework with AI
Get the answers you need in no time with our AI-driven, step-by-step assistance
Get Started
Database Horse Betting The Road To Absolute Horse Racing 2
Authors: NAKAGAWA,YUKIO
1st Edition
B0CFZN219G, 979-8856410593