Hello,
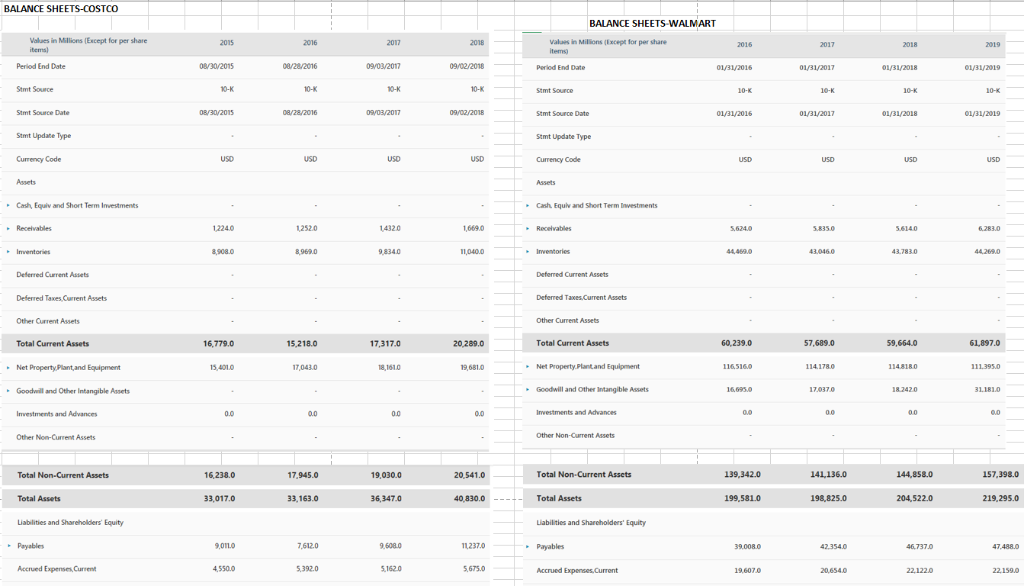
Please help with this finance problem for comparing Costco to Walmart using below financials
1) Compare Walmart's inventory and receivables turnover ratios for the most recent year to Costco's
1a) Compute the inventory turnover ratio as cost of revenue/inventory
1b) Compute the receivable turnover ratio as total revenueet receivables
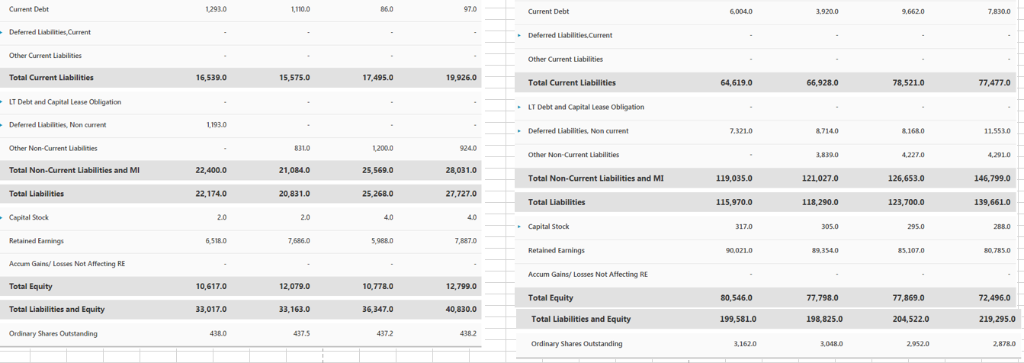
2) Now assume Walmart matches Costco's inventory and receivables turnover ratios without changing its payable days
2a) How much would Walmart's free-cash flow change relative to its current situation?
2b) What would Walmart's CCC be in this case?
3) What are your impressions regarding Walmart's working capital management based on this preliminary analysis? Discuss any advantages and disadvantages of attempting to match Costco's cash conversion cycle.
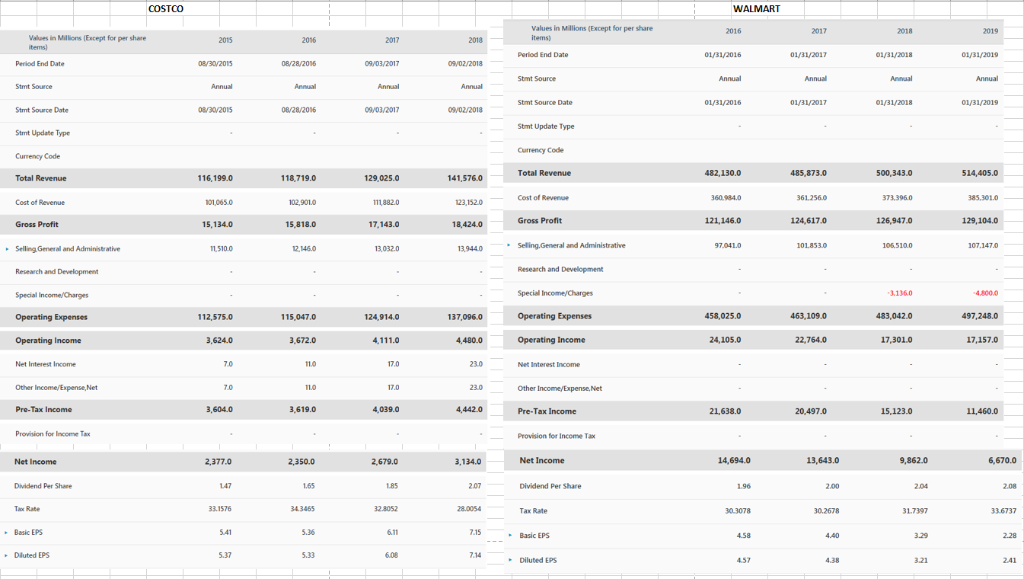
COSTCO WALMART Values in Millions (Except for per share 2016 2017 2018 2019 Values in Millions (Except for per share items) 2017 2015 2016 2018 Period End Date 01/31/2016 01/31/2017 01/31/2018 01/31/2019 08/28/2016 Period End Date 08/30/2015 09/03/2017 09/02/2018 Annual Annual Stmt Source Annal Annua Stmt Source Annual Apnual Annual Annual 01/31/2017 01/31/2018 Stmt Source Date 01/31/2016 01/31/2019 Stmt Source Date 08/30/2015 08/28/2016 09/03/2017 09/02/2018 Stmt Undate Tyne Stmt Update Typer Currency Code Currency Code 500 343.0 Total Revenue 482.130.0 485 873.0 514.405.0 118,719.0 129 025.0 Total Revenue 116,199.0 141.576.0 Cost of Revenue 360.984.0 361.256.0 373,3960 385.301.0 Coct of Bevenue 101 065 0 102.9010 m8820 123.1520 Gross Profit 121,146.0 124.617.0 126,947.0 129,104.0 Gross Profit 15,134.0 15.818.0 17,143.0 18,424.0 101.853 0 Seling.General and Administrative 97.041.0 106.5100 107.147.0 Selling Genera 12 146.0 13 032.0 d Administrative 1 510.0 13,9440 Research and Development Research and Development Special Income/Charges 3.136.0 4800.0 Special Income/Charges Operating Expenses 463.109.0 483,042.0 497.248.0 Operating Expenses 124 914.0 458 025.0 112 575.C 115 047.0 137,096.0 22.764.0 Operating Income 3.624.0 3,672.0 4.111.0 4,480.0 Operating Income 24,105.0 17,301.0 17,157.0 Net Interest Income 71 11 4 17.0 23 Net Interest Income Other Income/Expense, Net 110 Other Income/Expense Net 71 17 C 23.0 4.039.0 Pre-Tax Income 3,604.0 3619.0 4,442.0 21.638.0 20.497.0 15,123.0 Pre-Tax Income 11,460.0 Provision for Income Tax Provision for Income Tax Net Income 14,694.0 13,643.0 9,862.0 6,670.0 Net Income 2,377.0 2,350.0 2 679.0 3,134.0 16 pividend Per Share Dividend Per Share 147 185 201 1 96 2 0 204 208 33.1576 343465 Tax Rate 32 ans7 28.0054 Tax Rate 30.3078 30.2678 31.7397 33.6737 Basic EPS 541 536 611 715 Basic EPS 458 4 A0 3.29 2.29 Dduted EPS 5.37 533 714 Diluted EPS 4.38 3.21 41 BALANCE SHEETS-COSTCO BALANCE SHEETS-WALMART Values in Millions (Except for per share valaes in Milions (Except for per share items) 2015 2016 2012 2018 2018 2016 2017 2019 tems Period End Date 08/30/2015 08/28/2016 09/03/2017 09/02/2018 Perlod End Dater 01/31/2016 01/31/2017 01/31/2018 01/31/2019 10-8 Stmt Source 10-M 10- Stmt Source 10-K 10-6 10-8 10-5 Stet Source Date 08/30/20154 08/28/2016 09/02/2018 09/03/2017 o1/11/2017 Stmt Source Dater 01/31/2016 01/31/2018 01/31/2019 Stmt Update Type Stmt Update Type Currency Code usp uSD Currency Code USC uSD usr Assets Assets Cash, Equiv and Short Term Investments Cash Fouly and Short Term tavestment Receivables 12240 1252.0 14320 16690 Receivables 5624.0 5.835.0 5.614.0 6.283.0 44.499 0 43046 0 8908.0 n040.0 Inventories 8969.0 98340 Inventories 42 792 0 44269.0 Deferred Current Assets Deferred Current Assets Deferred TaxesCurrent Assets Deferred Taxes Current Assets Other Current Assets Other Current Assets Total Current Assets Tatal Current Assets 16 779.0 15 218.0 17.317.0 20.289.0 60.239.0 57,689.0 59.664.0 61,897,0 Net Property Plantand Eouipment Net Property Plant and Equipment 165160 1141780 114.818.0 111 205.0 15.4010 17 0430 18.1610 19.681.0 Goodwill and Other Intangible Assets Goodwill and 0ther Intangible Assets 16695.0 170370 18.2420 31.181.0 Investments and Advances Investments and Advances Other Non-Current Assets Other Non-Current Assets Total Non-Current Assets Total Non-Current Assets 16 238.0 17.945.0 19.030.0 139,342.0 141,136.0 144.858.0 157,398.0 20.541.0 204.522 0 Total Assets 33 017.0 33 163.0 36.347.0 40 830 0 Total Assets 199 581 0 198 825.0 219,295.0 Uabilities and Shareholders Equity Liabilities and Shareholders' Equity Payables 9,0110 7,612.0 9608.0 1237.0 Pavables 39,008.0 42354.0 46,7370 47.488.0 4550.0 s392.0 51620 5675.0 Accrued Expenses Current Accrued Expenses.Current 196070 22.122.0 206540 22.159.0 6C Cument Debt. 1293.0 110.0 97.0 Current Debt 6,004.09 3,920.0 9,662.0 7.830.0 Defermed Liablities Currents Defered Liabilities.Current Other Current Liabilities Other Current Liabilities Total Current Liabilities 16,539.0 15.575.0 17,495.0 19,926.0 Total Current Liabilities 64,619.0 66.928.0 78.521.0 77,477.0 T Debt and Capital Lease Obligation LT Debt and Capital Lease Obligation Defered Liabilties, Non current 193.0 Delerred Liabilities, Non current 7.321.0 87140 81680 11,5530 Other Non-Current Labilities 8310 12000 9240 Other Non-Current Liabilities 3839.0 4.227.0 4.291.0 21.084.0 25.569.0 28.031.0 Total Non-Current Liabilities and MI 22.400.0 Total Non-Current Liabilities and MI 119.035.0 121,027.0 126.653.0 146.799.0 22,174.0 20 831.0 25 268.0 27.727.0 Total Liabilities 115.970.0 123.700.0 Total Liabilities 118 290 0 139.661.0 Capital Stock 2.0 20 40 Capital Stock 288.0 317.0 305.0 295.0 6.518.0 7,887.0 Retained Eamings 7686.0 5 g880 90,021.0 85.107.0 Retained Eamings s9 254 0 s0 7850 Accum Gains/ Losses Not Affecting R Accum Gains/ Losses Not Affecting RE Total Equity 10 617.0 12.079.0 10.778.0 12,799.0 Total Equity 80.546.0 77,798.0 77,869.0 72.496.0 Total Liabilities and Equity 33 017.0 33 163.0 36.347.0 40.830,0 Total Liabilities and Equity 199.581.0 198.825.0 204,522.0 219,295.0 Ordinary Shares Outstanding 438.2 438.0 437.5 437 2 Ordinary Shares Outstanding 3.162.0 3048.0 2,952.0 2,878.0 COSTCO WALMART Values in Millions (Except for per share 2016 2017 2018 2019 Values in Millions (Except for per share items) 2017 2015 2016 2018 Period End Date 01/31/2016 01/31/2017 01/31/2018 01/31/2019 08/28/2016 Period End Date 08/30/2015 09/03/2017 09/02/2018 Annual Annual Stmt Source Annal Annua Stmt Source Annual Apnual Annual Annual 01/31/2017 01/31/2018 Stmt Source Date 01/31/2016 01/31/2019 Stmt Source Date 08/30/2015 08/28/2016 09/03/2017 09/02/2018 Stmt Undate Tyne Stmt Update Typer Currency Code Currency Code 500 343.0 Total Revenue 482.130.0 485 873.0 514.405.0 118,719.0 129 025.0 Total Revenue 116,199.0 141.576.0 Cost of Revenue 360.984.0 361.256.0 373,3960 385.301.0 Coct of Bevenue 101 065 0 102.9010 m8820 123.1520 Gross Profit 121,146.0 124.617.0 126,947.0 129,104.0 Gross Profit 15,134.0 15.818.0 17,143.0 18,424.0 101.853 0 Seling.General and Administrative 97.041.0 106.5100 107.147.0 Selling Genera 12 146.0 13 032.0 d Administrative 1 510.0 13,9440 Research and Development Research and Development Special Income/Charges 3.136.0 4800.0 Special Income/Charges Operating Expenses 463.109.0 483,042.0 497.248.0 Operating Expenses 124 914.0 458 025.0 112 575.C 115 047.0 137,096.0 22.764.0 Operating Income 3.624.0 3,672.0 4.111.0 4,480.0 Operating Income 24,105.0 17,301.0 17,157.0 Net Interest Income 71 11 4 17.0 23 Net Interest Income Other Income/Expense, Net 110 Other Income/Expense Net 71 17 C 23.0 4.039.0 Pre-Tax Income 3,604.0 3619.0 4,442.0 21.638.0 20.497.0 15,123.0 Pre-Tax Income 11,460.0 Provision for Income Tax Provision for Income Tax Net Income 14,694.0 13,643.0 9,862.0 6,670.0 Net Income 2,377.0 2,350.0 2 679.0 3,134.0 16 pividend Per Share Dividend Per Share 147 185 201 1 96 2 0 204 208 33.1576 343465 Tax Rate 32 ans7 28.0054 Tax Rate 30.3078 30.2678 31.7397 33.6737 Basic EPS 541 536 611 715 Basic EPS 458 4 A0 3.29 2.29 Dduted EPS 5.37 533 714 Diluted EPS 4.38 3.21 41 BALANCE SHEETS-COSTCO BALANCE SHEETS-WALMART Values in Millions (Except for per share valaes in Milions (Except for per share items) 2015 2016 2012 2018 2018 2016 2017 2019 tems Period End Date 08/30/2015 08/28/2016 09/03/2017 09/02/2018 Perlod End Dater 01/31/2016 01/31/2017 01/31/2018 01/31/2019 10-8 Stmt Source 10-M 10- Stmt Source 10-K 10-6 10-8 10-5 Stet Source Date 08/30/20154 08/28/2016 09/02/2018 09/03/2017 o1/11/2017 Stmt Source Dater 01/31/2016 01/31/2018 01/31/2019 Stmt Update Type Stmt Update Type Currency Code usp uSD Currency Code USC uSD usr Assets Assets Cash, Equiv and Short Term Investments Cash Fouly and Short Term tavestment Receivables 12240 1252.0 14320 16690 Receivables 5624.0 5.835.0 5.614.0 6.283.0 44.499 0 43046 0 8908.0 n040.0 Inventories 8969.0 98340 Inventories 42 792 0 44269.0 Deferred Current Assets Deferred Current Assets Deferred TaxesCurrent Assets Deferred Taxes Current Assets Other Current Assets Other Current Assets Total Current Assets Tatal Current Assets 16 779.0 15 218.0 17.317.0 20.289.0 60.239.0 57,689.0 59.664.0 61,897,0 Net Property Plantand Eouipment Net Property Plant and Equipment 165160 1141780 114.818.0 111 205.0 15.4010 17 0430 18.1610 19.681.0 Goodwill and Other Intangible Assets Goodwill and 0ther Intangible Assets 16695.0 170370 18.2420 31.181.0 Investments and Advances Investments and Advances Other Non-Current Assets Other Non-Current Assets Total Non-Current Assets Total Non-Current Assets 16 238.0 17.945.0 19.030.0 139,342.0 141,136.0 144.858.0 157,398.0 20.541.0 204.522 0 Total Assets 33 017.0 33 163.0 36.347.0 40 830 0 Total Assets 199 581 0 198 825.0 219,295.0 Uabilities and Shareholders Equity Liabilities and Shareholders' Equity Payables 9,0110 7,612.0 9608.0 1237.0 Pavables 39,008.0 42354.0 46,7370 47.488.0 4550.0 s392.0 51620 5675.0 Accrued Expenses Current Accrued Expenses.Current 196070 22.122.0 206540 22.159.0 6C Cument Debt. 1293.0 110.0 97.0 Current Debt 6,004.09 3,920.0 9,662.0 7.830.0 Defermed Liablities Currents Defered Liabilities.Current Other Current Liabilities Other Current Liabilities Total Current Liabilities 16,539.0 15.575.0 17,495.0 19,926.0 Total Current Liabilities 64,619.0 66.928.0 78.521.0 77,477.0 T Debt and Capital Lease Obligation LT Debt and Capital Lease Obligation Defered Liabilties, Non current 193.0 Delerred Liabilities, Non current 7.321.0 87140 81680 11,5530 Other Non-Current Labilities 8310 12000 9240 Other Non-Current Liabilities 3839.0 4.227.0 4.291.0 21.084.0 25.569.0 28.031.0 Total Non-Current Liabilities and MI 22.400.0 Total Non-Current Liabilities and MI 119.035.0 121,027.0 126.653.0 146.799.0 22,174.0 20 831.0 25 268.0 27.727.0 Total Liabilities 115.970.0 123.700.0 Total Liabilities 118 290 0 139.661.0 Capital Stock 2.0 20 40 Capital Stock 288.0 317.0 305.0 295.0 6.518.0 7,887.0 Retained Eamings 7686.0 5 g880 90,021.0 85.107.0 Retained Eamings s9 254 0 s0 7850 Accum Gains/ Losses Not Affecting R Accum Gains/ Losses Not Affecting RE Total Equity 10 617.0 12.079.0 10.778.0 12,799.0 Total Equity 80.546.0 77,798.0 77,869.0 72.496.0 Total Liabilities and Equity 33 017.0 33 163.0 36.347.0 40.830,0 Total Liabilities and Equity 199.581.0 198.825.0 204,522.0 219,295.0 Ordinary Shares Outstanding 438.2 438.0 437.5 437 2 Ordinary Shares Outstanding 3.162.0 3048.0 2,952.0 2,878.0