Hello, please may I get some help with these questions
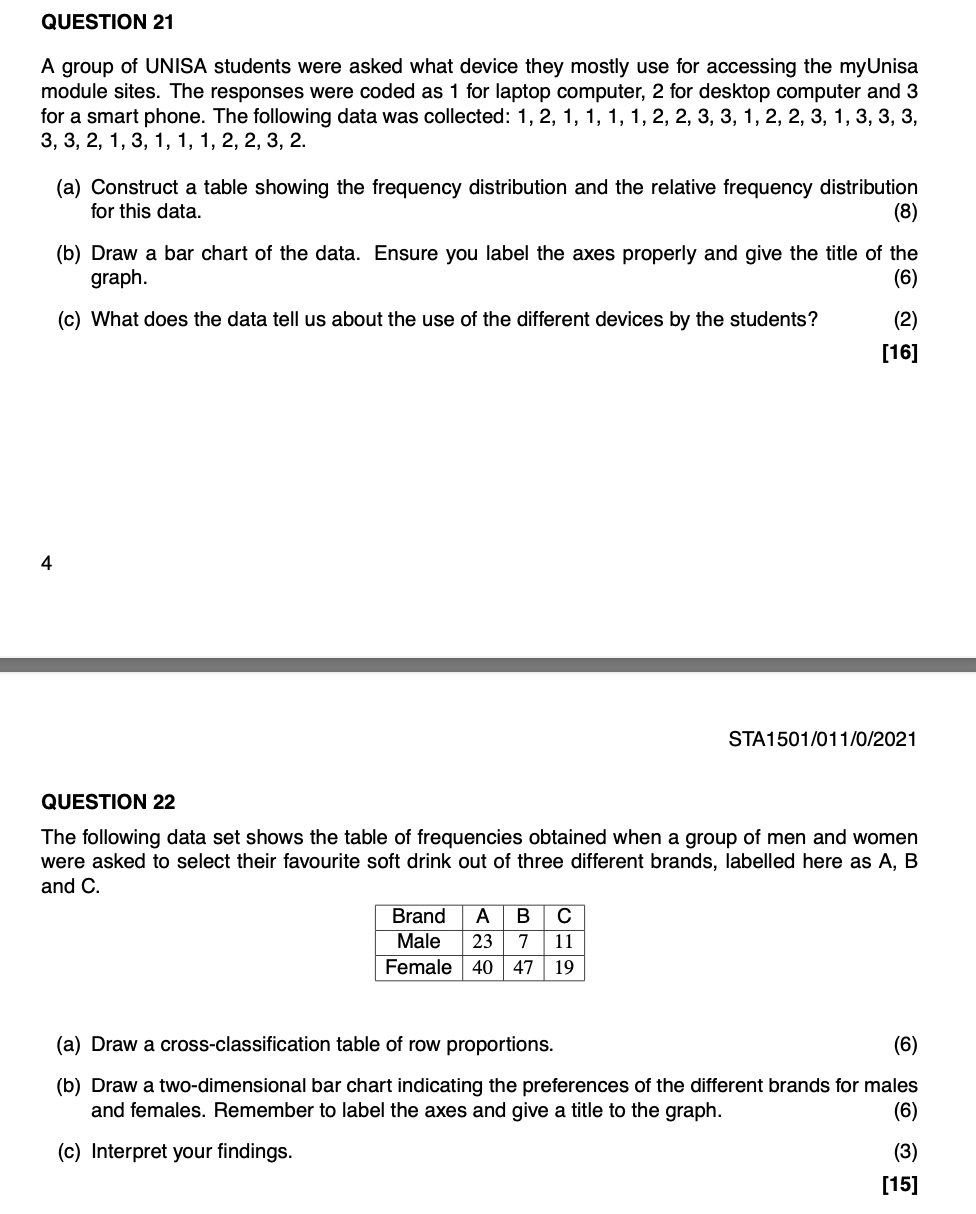
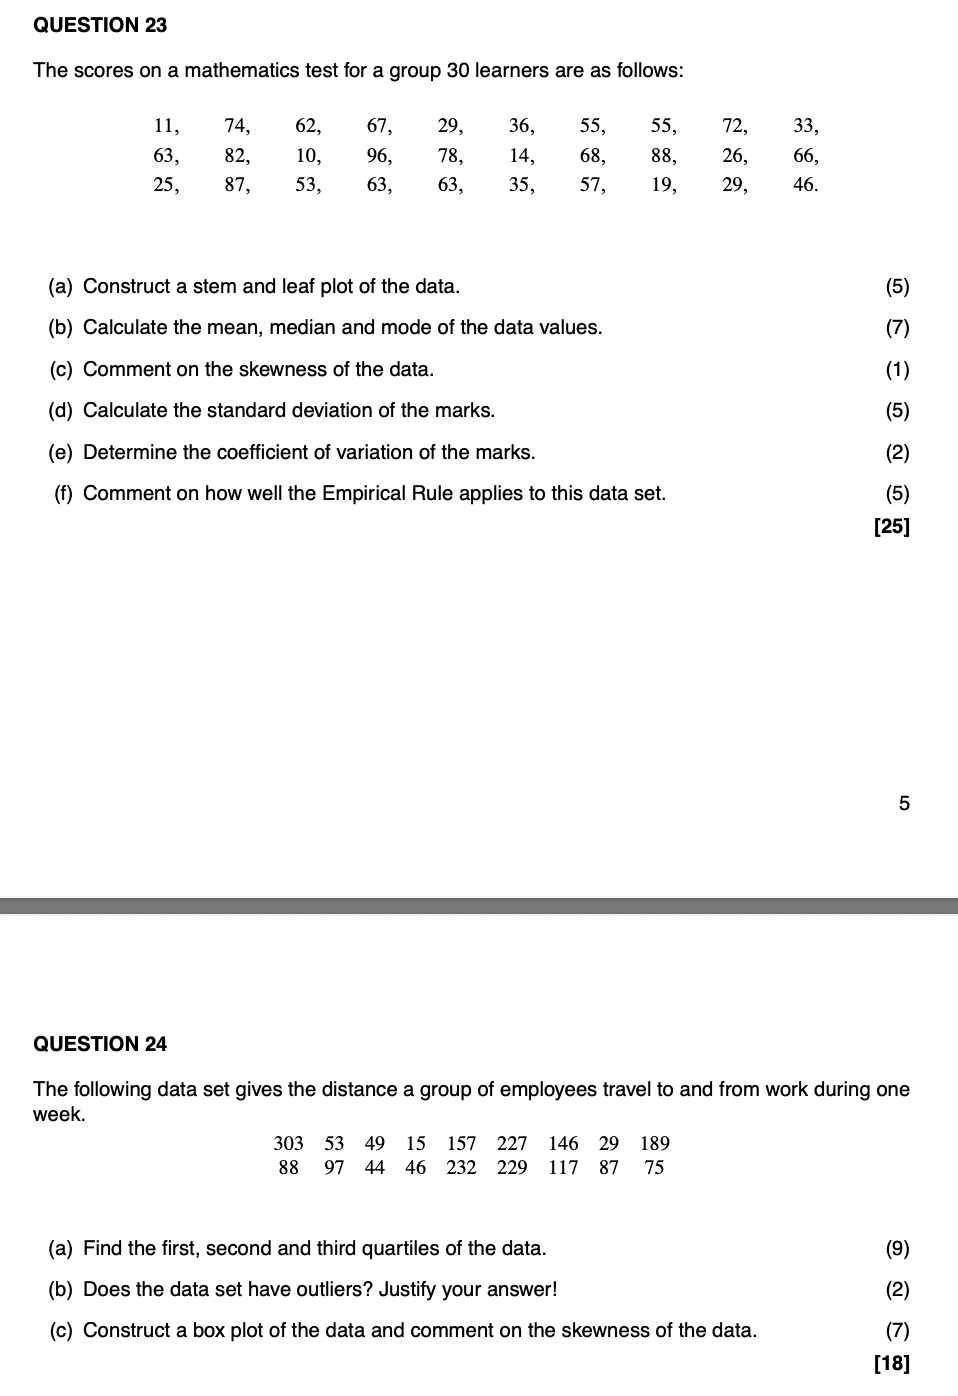
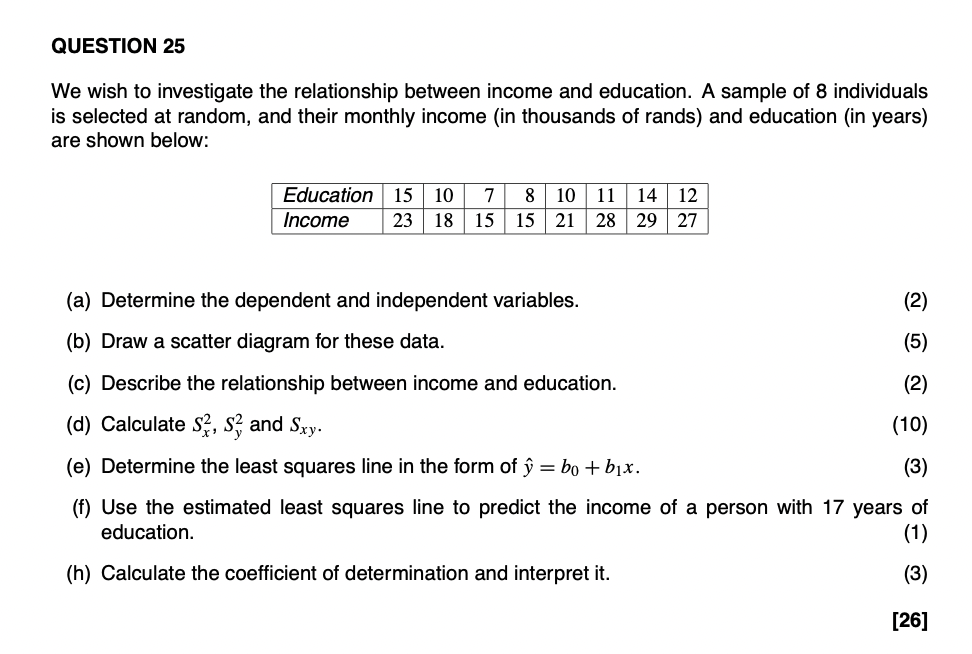
QUESTION 21 A group of UNISA students were asked what device they mostty use for accessing the myUnisa module sites. The responses were coded as 1 for laptop computer, 2 for desktop computer and 3 for a smart phone. The following data was collected: 1, 2, 1, 1, 1, 1, 2, 2, 3, 3, 1, 2, 2, 3, 1, 3, 3, 3, 3, 3, 2, 1,3, 1, 1, 1,2, 2, 3, 2. (a) Construct a table showing the frequency distribution and the relative frequency distribution for this data. (8) (b) Draw a bar chart of the data. Ensure you label the axes properly and give the title of the graph. (6) (c) What does the data tell us about the use of the different devices by the students? (2) [16] STA1501I'01 11012021 QUESTION 22 The following data set shows the table of frequencies obtained when a group of men and women were asked to select their favourite soft drink out of three different brands, labelled here as A, B and C. _--IEI (a) Draw a cross-classification table of row proportions. (6) (b) Draw a two-dimensional bar chart indicating the preferences of the different brands for males and females. Remember to label the axes and give a title to the graph. (6) (c) Interpret your findings. (3) [15] QUESTION 23 The scores on a mathematics test for a group 30 learners are as follows: 11, 74, 62, 67, 29, 36, 55, 55, 72, 33, 63, 32, 10, 96, 78, 14, 68, 88, 26, 66, 25, 37, 53, 63, 63, 35, 57, 19, 29, 46. (a) Construct a stem and leaf plot of the data. (5) (b) Calculate the mean, median and mode of the data values. (7) (0) Comment on the skewness of the data. (1) (d) Calculate the standard deviation of the marks. (5) (e) Determine the coefficient of variation of the marks. (2) (f) Comment on how well the Empirical Rule applies to this data set. (5) [25] 5 QUESTION 24 The following data set gives the distance a group of employees travel to and from work during one week. 303 53 49 15 157 227 146 29 189 88 97 44 46 232 229 117 87 75 (a) Find the first, second and third quartiles of the data. (9) (b) Does the data set have outliers? Justify your answer! (2) (0) Construct a box plot of the data and comment on the skewness of the data. (7) [13] QUESTION 25 We wish to investigate the relationship between income and education. A sample of 3 individuals is selected at random, and their monthly income (in thousands of rands) and education (in years) are shown below: Education 15 10 7 s 10|11 | 14 12 Income 23 1s 15 15 21 28 29 27 (a) Determine the dependent and independent variables. (2) (b) Draw a scatter diagram for these data. (5) (c) Describe the relationship between income and education. (2) (d) Calculate SE, SE, and Sxy. (10) (9) Determine the least squares line in the form of i = be + blx. (3) (f) Use the estimated least squares line to predict the income of a person with 17 years of education. (1) (h) Calculate the coefficient of determination and interpret it. (3) [26]


