Answered step by step
Verified Expert Solution
Question
1 Approved Answer
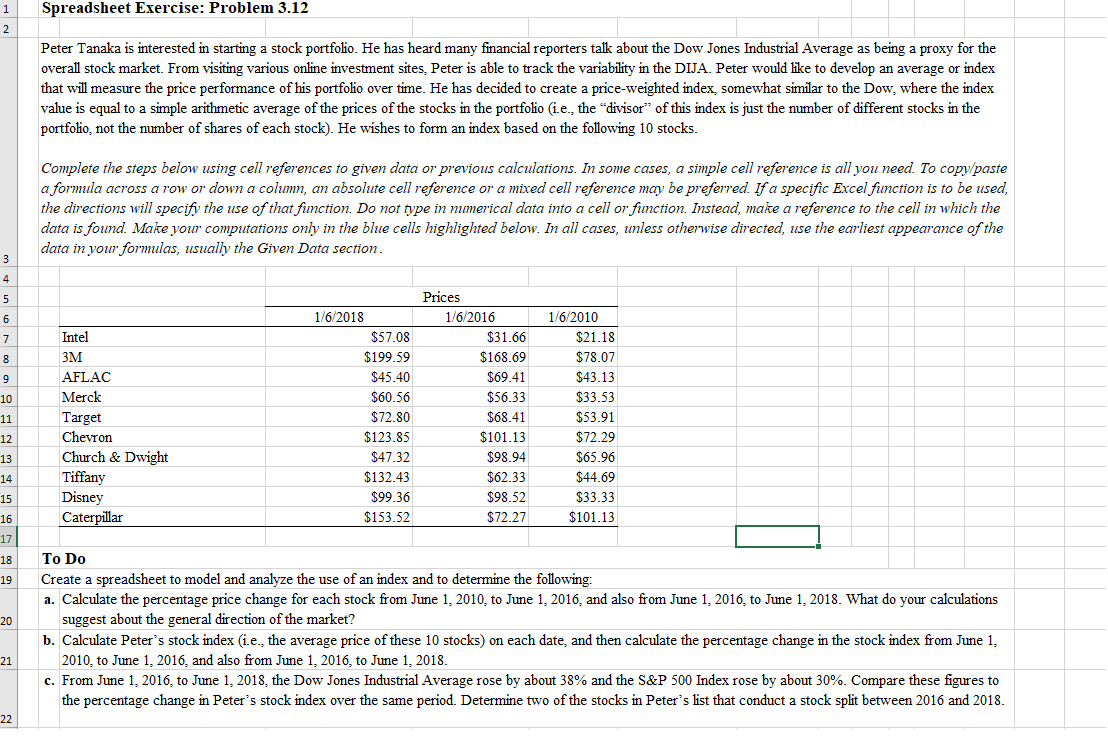
Hello, please provide the excel formulas. ty 1 2 Spreadsheet Exercise: Problem 3.12 Peter Tanaka is interested in starting a stock portfolio. He has heard


 Hello, please provide the excel formulas. ty
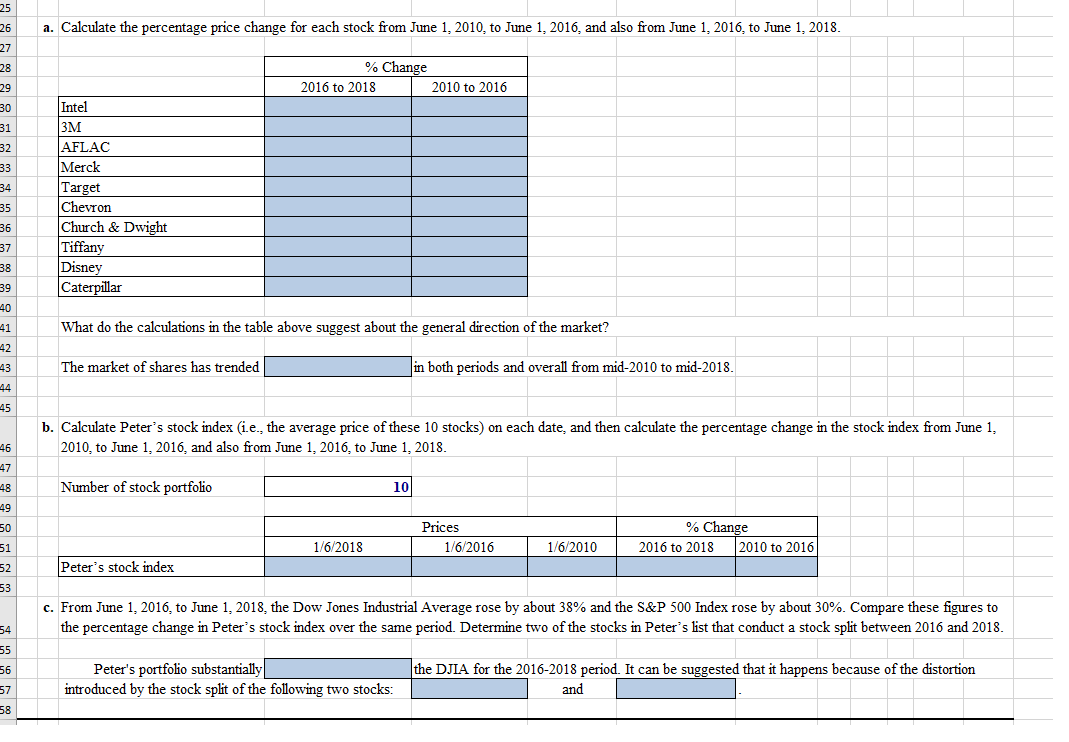
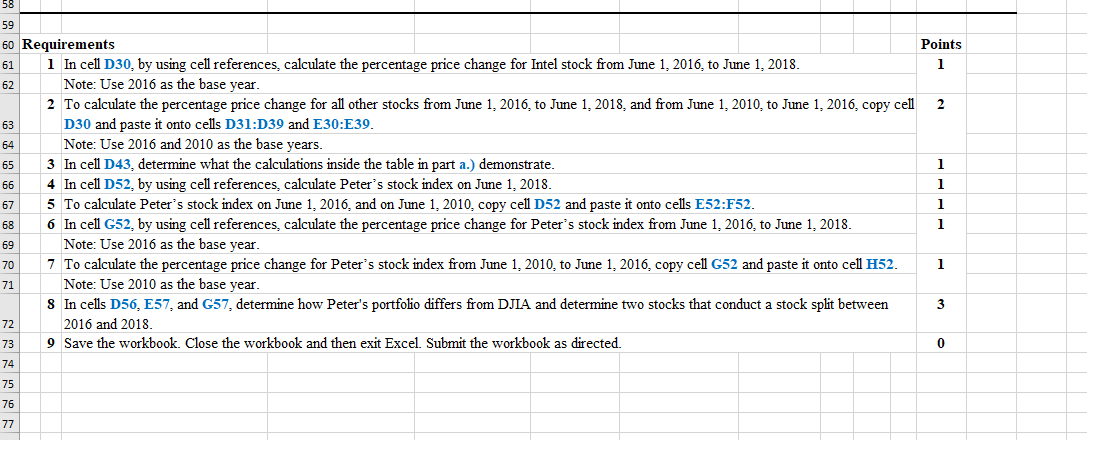
1 2 Spreadsheet Exercise: Problem 3.12 Peter Tanaka is interested in starting a stock portfolio. He has heard many financial reporters talk about the Dow Jones Industrial Average as being a proxy for the overall stock market. From visiting various online investment sites, Peter is able to track the variability in the DIJA. Peter would like to develop an average or index that will measure the price performance of his portfolio over time. He has decided to create a price-weighted index, somewhat similar to the Dow, where the index value is equal to a simple arithmetic average of the prices of the stocks in the portfolio (i.e., the "divisor" of this index is just the number of different stocks in the portfolio, not the number of shares of each stock). He wishes to form an index based on the following 10 stocks. Complete the steps below using cell references to given data or previous calculations. In some cases, a simple cell reference is all you need to copy/paste a formula across a row or down a column, an absolute cell reference or a mixed cell reference may be preferred. If a specific Excel function is to be used, the directions will specify the use of that function. Do not type in numerical data into a cell or function. Instead, make a reference to the cell in which the data is found. Make your computations only in the blue cells highlighted below. In all cases, unless otherwise directed, use the earliest appearance of the data in your formulas, usually the Given Data section. 3 4 5 6 7 Intel 8 9 10 11 12 3M AFLAC Merck Target Chevron Church & Dwight Tiffany Disney Caterpillar 1/6/2018 $57.08 $199.59 $45.40 $60.56 $72.80 $123.85 $47.32 $132.43 $99.36 $153.52 Prices 1/6/2016 $31.66 $168.69 $69.41 $56.33 $68.41 $101.13 $98.94 $62.33 $98.52 $72.27 1/6/2010 $21.18 $78.07 $43.13 $33.53 $53.91 $72.29 $65.96 $44.69 $33.33 $101.13 13 14 15 16 17| 18 19 20 To Do Create a spreadsheet to model and analyze the use of an index and to determine the following: a. Calculate the percentage price change for each stock from June 1, 2010, to June 1, 2016, and also from June 1, 2016, to June 1, 2018. What do your calculations suggest about the general direction of the market? b. Calculate Peter's stock index (i.e. the average price of these 10 stocks) on each date, and then calculate the percentage change in the stock index from June 1, 2010, to June 1, 2016, and also from June 1, 2016, to June 1, 2018. c. From June 1, 2016, to June 1, 2018, the Dow Jones Industrial Average rose by about 38% and the S&P 500 Index rose by about 30%. Compare these figures to the percentage change in Peter's stock index over the same period. Determine two of the stocks in Peter's list that conduct a stock split between 2016 and 2018. 21 22 a. Calculate the percentage price change for each stock from June 1, 2010, to June 1, 2016, and also from June 1, 2016, to June 1, 2018. % Change 2016 to 2018 2010 to 2016 25 26 27 28 29 30 31 32 33 34 35 36 37 38 39 40 41 42 43 44 45 Intel 3M AFLAC Merck Target Chevron Church & Dwight Tiffany Disney Caterpillar What do the calculations in the table above suggest about the general direction of the market? The market of shares has trended in both periods and overall from mid-2010 to mid-2018. b. Calculate Peter's stock index (i.e., the average price of these 10 stocks) on each date, and then calculate the percentage change in the stock index from June 1, 2010, to June 1, 2016, and also from June 1, 2016, to June 1, 2018. Number of stock portfolio 10 46 47 48 49 50 51 52 53 Prices 1/6/2016 % Change 2016 to 2018 2010 to 2016 1/6/2018 1/6/2010 Peter's stock index c. From June 1, 2016, to June 1, 2018, the Dow Jones Industrial Average rose by about 38% and the S&P 500 Index rose by about 30%. Compare these figures to the percentage change in Peter's stock index over the same period. Determine two of the stocks in Peter's list that conduct a stock split between 2016 and 2018. 54 55 56 Peter's portfolio substantially introduced by the stock split of the following two stocks: the DJIA for the 2016-2018 period. It can be suggested that it happens because of the distortion and 57 58 62 58 59 60 Requirements Points 61 1 In cell D30, by using cell references, calculate the percentage price change for Intel stock from June 1, 2016, to June 1, 2018. 1 Note: Use 2016 as the base year. 2 To calculate the percentage price change for all other stocks from June 1, 2016, to June 1, 2018, and from June 1, 2010, to June 1, 2016, copy cell 2 63 D30 and paste it onto cells D31:D39 and E30:E39. 64 Note: Use 2016 and 2010 as the base years. 65 3 In cell D43, determine what the calculations inside the table in part a.) demonstrate. 1 66 4 In cell D52, by using cell references, calculate Peter's stock index on June 1, 2018. 1 67 5 To calculate Peter's stock index on June 1, 2016, and on June 1, 2010, copy cell D52 and paste it onto cells E52:F52. 1 68 6 In cell G52, by using cell references, calculate the percentage price change for Peter's stock index from June 1, 2016, to June 1, 2018. 1 69 Note: Use 2016 as the base year. 70 7 To calculate the percentage price change for Peter's stock index from June 1, 2010, to June 1, 2016, copy cell G52 and paste it onto cell H52. 1 71 Note: Use 2010 as the base year. 8 In cells D56, E57, and G57, determine how Peter's portfolio differs from DJIA and determine two stocks that conduct a stock split between 3 72 2016 and 2018 73 9 Save the workbook. Close the workbook and then exit Excel. Submit the workbook as directed. 0 74 75 76 77
Step by Step Solution
There are 3 Steps involved in it
Step: 1

Get Instant Access to Expert-Tailored Solutions
See step-by-step solutions with expert insights and AI powered tools for academic success
Step: 2

Step: 3

Ace Your Homework with AI
Get the answers you need in no time with our AI-driven, step-by-step assistance
Get Started


