Hello ,Please solve this problem as soon as possible ,I'm on a test , and please show and describe how the calculations had been made on an excel sheet
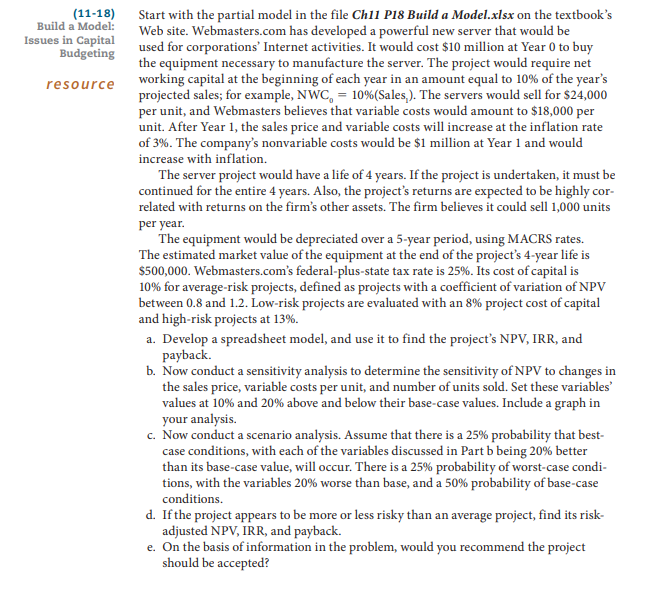
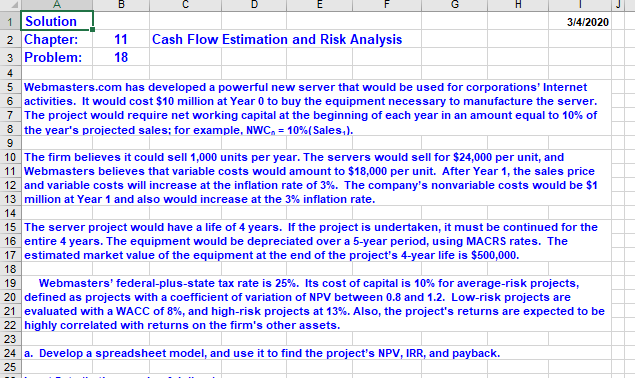
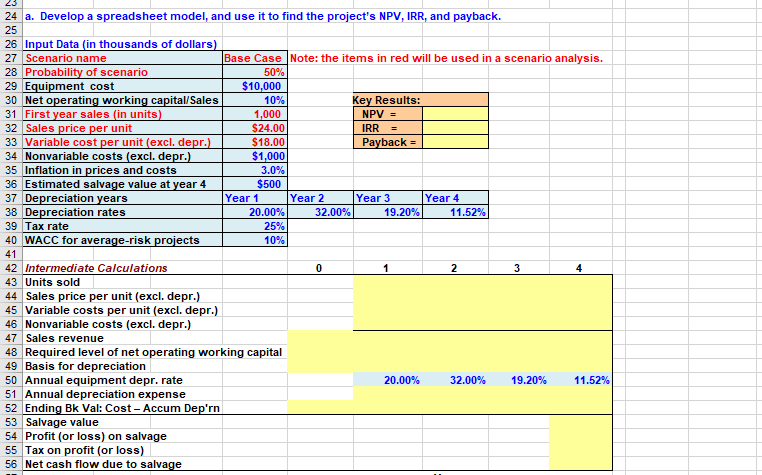
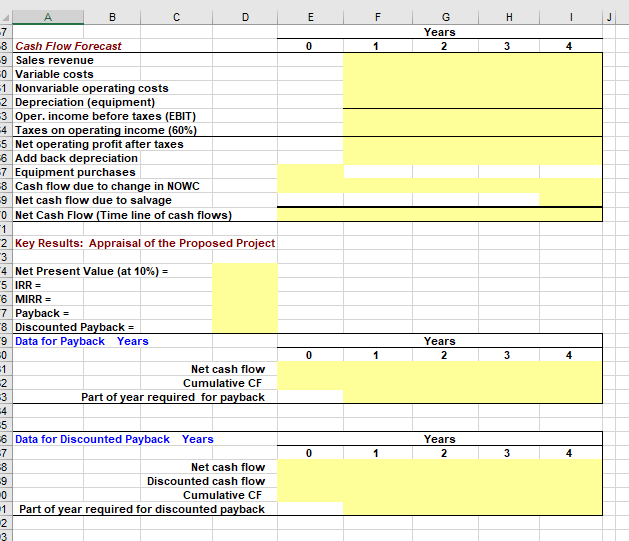
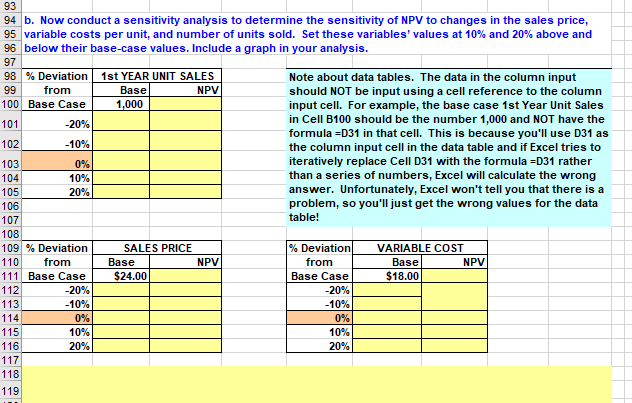
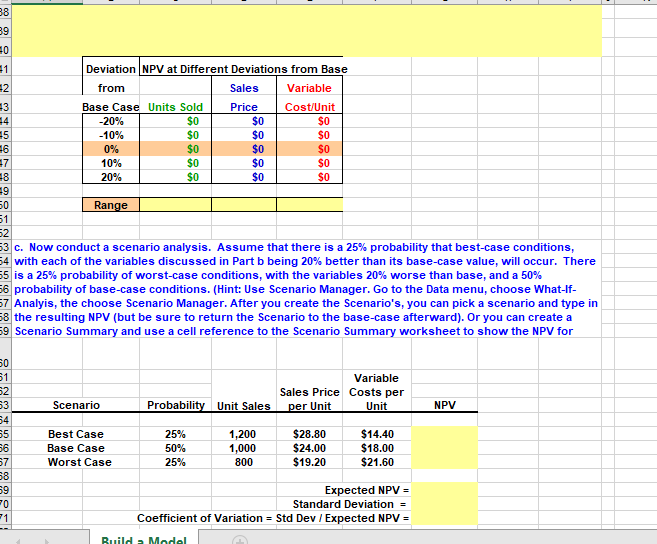
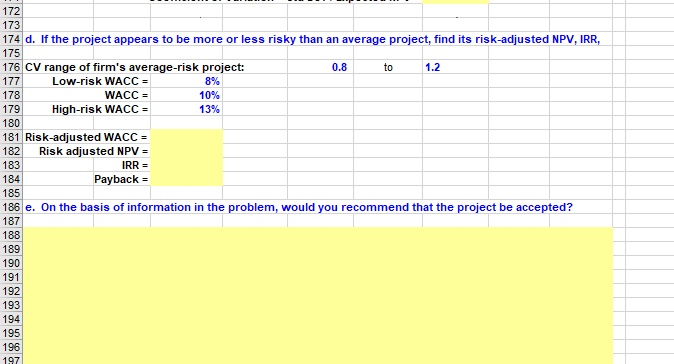
(11-18) Build a Model: Issues in Capital Budgeting resource Start with the partial model in the file Ch11 P18 Build a Model.xlsx on the textbook's Web site. Webmasters.com has developed a powerful new server that would be used for corporations' Internet activities. It would cost $10 million at Year 0 to buy the equipment necessary to manufacture the server. The project would require net working capital at the beginning of each year in an amount equal to 10% of the year's projected sales; for example, NWC, 10% (Sales,). The servers would sell for $24,000 per unit, and Webmasters believes that variable costs would amount to $18,000 per unit. After Year 1, the sales price and variable costs will increase at the inflation rate of 3%. The company's nonvariable costs would be $1 million at Year 1 and would increase with inflation. The server project would have a life of 4 years. If the project is undertaken, it must be continued for the entire 4 years. Also, the project's returns are expected to be highly cor- related with returns on the firm's other assets. The firm believes it could sell 1,000 units per year. The equipment would be depreciated over a 5-year period, using MACRS rates. The estimated market value of the equipment at the end of the project's 4-year life is $500,000. Webmasters.com's federal-plus-state tax rate is 25%. Its cost of capital is 10% for average-risk projects, defined as projects with a coefficient of variation of NPV between 0.8 and 1.2. Low-risk projects are evaluated with an 8% project cost of capital and high-risk projects at 13%. a. Develop a spreadsheet model, and use it to find the project's NPV, IRR, and payback. b. Now conduct a sensitivity analysis to determine the sensitivity of NPV to changes in the sales price, variable costs per unit, and number of units sold. Set these variables' values at 10% and 20% above and below their base-case values. Include a graph in your analysis. c. Now conduct a scenario analysis. Assume that there is a 25% probability that best- case conditions, with each of the variables discussed in Part b being 20% better than its base-case value, will occur. There is a 25% probability of worst-case condi- tions, with the variables 20% worse than base, and a 50% probability of base-case conditions. d. If the project appears to be more or less risky than an average project, find its risk- adjusted NPV, IRR, and payback. e. On the basis of information in the problem, would you recommend the project should be accepted? B E G H 1 Solution 3/4/2020 2 Chapter: 11 Cash Flow Estimation and Risk Analysis 3 Problem: 18 4 5 Webmasters.com has developed a powerful new server that would be used for corporations' Internet 6 activities. It would cost $10 million at Year 0 to buy the equipment necessary to manufacture the server. 7 The project would require net working capital at the beginning of each year in an amount equal to 10% of 8 the year's projected sales; for example, NWC, 10% (Sales,). 9 10 The firm believes it could sell 1,000 units per year. The servers would sell for $24,000 per unit, and 11 Webmasters believes that variable costs would amount to $18,000 per unit. After Year 1, the sales price 12 and variable costs will increase at the inflation rate of 3%. The company's nonvariable costs would be $1 13 million at Year 1 and also would increase at the 3% inflation rate. 14 15 The server project would have a life of 4 years. If the project is undertaken, it must be continued for the 16 entire 4 years. The equipment would be depreciated over a 5-year period, using MACRS rates. The 17 estimated market value of the equipment at the end of the project's 4-year life is $500,000. 18 19 Webmasters' federal-plus-state tax rate is 25%. Its cost of capital is 10% for average-risk projects, 20 defined as projects with a coefficient of variation of NPV between 0.8 and 1.2. Low-risk projects are 21 evaluated with a WACC of 8%, and high-risk projects at 13%. Also, the project's returns are expected to be 22 highly correlated with returns on the firm's other assets. 23 24 a. Develop a spreadsheet model, and use it to find the project's NPV, IRR, and payback. 25 23 24 a. Develop a spreadsheet model, and use it to find the project's NPV, IRR, and payback. 25 26 Input Data (in thousands of dollars) 27 Scenario name 28 Probability of scenario 29 Equipment cost 30 Net operating working capital/Sales 31 First year sales (in units) 32 Sales price per unit 33 Variable cost per unit (excl. depr.) 34 Nonvariable costs (excl. depr.) 35 Inflation in prices and costs 36 Estimated salvage value at year 4 37 Depreciation years 38 Depreciation rates 39 Tax rate 40 WACC for average-risk projects 41 42 Intermediate Calculations 43 Units sold 44 Sales price per unit (excl. depr.) 45 Variable costs per unit (excl. depr.) 46 Nonvariable costs (excl. depr.) 47 Sales revenue 48 Required level of net operating working capital 49 Basis for depreciation 50 Annual equipment depr. rate 51 Annual depreciation expense 52 Ending Bk Val: Cost - Accum Dep'rn 53 Salvage value 54 Profit (or loss) on salvage 55 Tax on profit (or loss) 56 Net cash flow due to salvage Base Case Note: the items in red will be used in a scenario analysis. 50% $10,000 Key Results: 1,000 NPV = $24.00 IRR $18.00 Payback = $1,000 3.0% 4 11.52% 10% $500 20.00% 25% 10% Year 1 Year 2 32.00% 0 Year 3 19.20% 1 20.00% Year 4 11.52% 2 3 32.00% 19.20% B C 7 8 Cash Flow Forecast -9 Sales revenue 0 Variable costs 1 Nonvariable operating costs 2 Depreciation (equipment) 3 Oper. income before taxes (EBIT) 4 Taxes on operating income (60%) 5 Net operating profit after taxes 6 Add back depreciation 7 Equipment purchases 8 Cash flow due to change in NOWC 9 Net cash flow due to salvage 0 Net Cash Flow (Time line of cash flows) 1 2 Key Results: Appraisal of the Proposed Project 3 4 Net Present Value (at 10%) = 5 IRR = 6 MIRR = 7 Payback = 8 Discounted Payback = 9 Data for Payback Years =0 1 Net cash flow -2 Cumulative CF -3 Part of year required for payback 4 5 6 Data for Discounted Payback Years -7 Net cash flow -9 Discounted cash flow 0 Cumulative CF 1 Part of year required for discounted payback 2 8 D 3 E 0 0 0 LL F 1 1 1 G Years 2 Years 2 Years 2 H 3 3 3 4 4 93 94 b. Now conduct a sensitivity analysis to determine the sensitivity of NPV to changes in the sales price, 95 variable costs per unit, and number of units sold. Set these variables' values at 10% and 20% above and 96 below their base-case values. Include a graph in your analysis. 97 98 % Deviation 1st YEAR UNIT SALES 99 from Base NPV 100 Base Case 101 -20% 102 -10% Note about data tables. The data in the column input should NOT be input using a cell reference to the column input cell. For example, the base case 1st Year Unit Sales in Cell B100 should be the number 1,000 and NOT have the formula =D31 in that cell. This is because you'll use D31 as the column input cell in the data table and if Excel tries to iteratively replace Cell D31 with the formula =D31 rather than a series of numbers, Excel will calculate the wrong answer. Unfortunately, Excel won't tell you that there is a problem, so you'll just get the wrong values for the data table! 103 0% 104 10% 105 20% 106 107 108 109 % Deviation % Deviation VARIABLE COST 110 from from Base 111 Base Case Base Case $18.00 112 -20% -20% 113 -10% -10% 114 0% 0% 115 10% 10% 116 20% 20% 117 118 119 1,000 SALES PRICE Base $24.00 NPV NPV 38 39 40 #1 Deviation NPV at Different Deviations from Base from Sales Variable Base Case Units Sold Price Cost/Unit -20% $0 $0 $0 -10% $0 $0 $0 0% $0 $0 $0 10% $0 $0 $0 20% $0 $0 $0 Range 52 53 c. Now conduct a scenario analysis. Assume that there is a 25% probability that best-case conditions, 54 with each of the variables discussed in Part b being 20% better than its base-case value, will occur. There 55 is a 25% probability of worst-case conditions, with the variables 20% worse than base, and a 50% 56 probability of base-case conditions. (Hint: Use Scenario Manager. Go to the Data menu, choose What-If- 57 Analyis, the choose Scenario Manager. After you create the Scenario's, you can pick a scenario and type in 58 the resulting NPV (but be sure to return the Scenario to the base-case afterward). Or you can create a 59 Scenario Summary and use a cell reference to the Scenario Summary worksheet to show the NPV for Sales Price per Unit Variable Costs per Unit Scenario Probability Unit Sales NPV Best Case 25% 1,200 $28.80 $14.40 50% 1,000 $24.00 $18.00 Base Case Worst Case 25% 800 $19.20 $21.60 Expected NPV = Standard Deviation = Coefficient of Variation = Std Dev / Expected NPV = 8GGAW N 43 44 45 46 47 48 149 50 51 50 - c i i B c N 61 52 53 64 65 56 67 68 70 71 Build a Model 172 173 174 d. If the project appears to be more or less risky than an average project, find its risk-adjusted NPV, IRR, 175 176 CV range of firm's average-risk project: 0.8 to 1.2 177 Low-risk WACC = 8% 178 WACC = 10% 13% 179 High-risk WACC = 180 181 Risk-adjusted WACC = 182 Risk adjusted NPV = 183 IRR = Payback = 184 185 186 e. On the basis of information in the problem, would you recommend that the project be accepted? 187 188 189 190 191 192 193 194 195 196 197