Hello Sir/ Ma'am,
Could I please receive help with these questions.These are related to 'polynomial functions.' It would be great if someone helped me out with these. Thank you in advance to whoever decides to help me out!
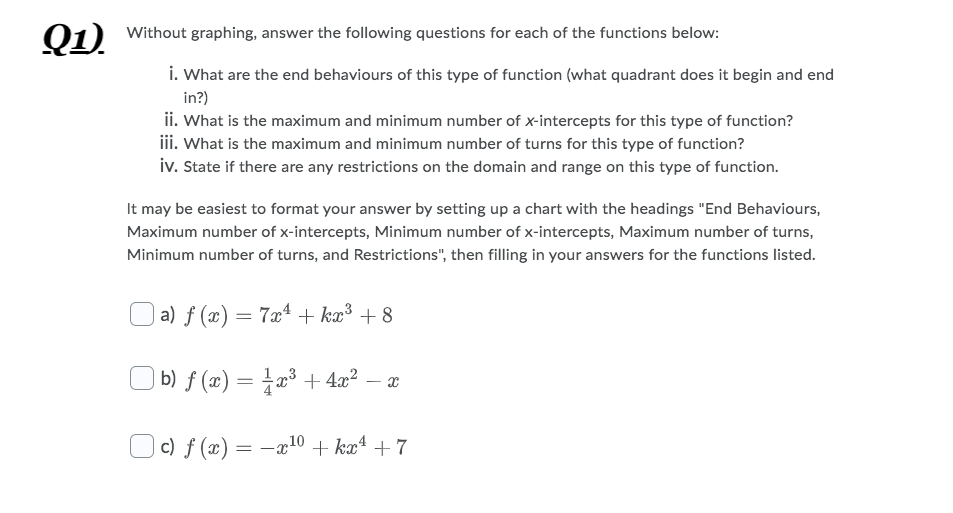
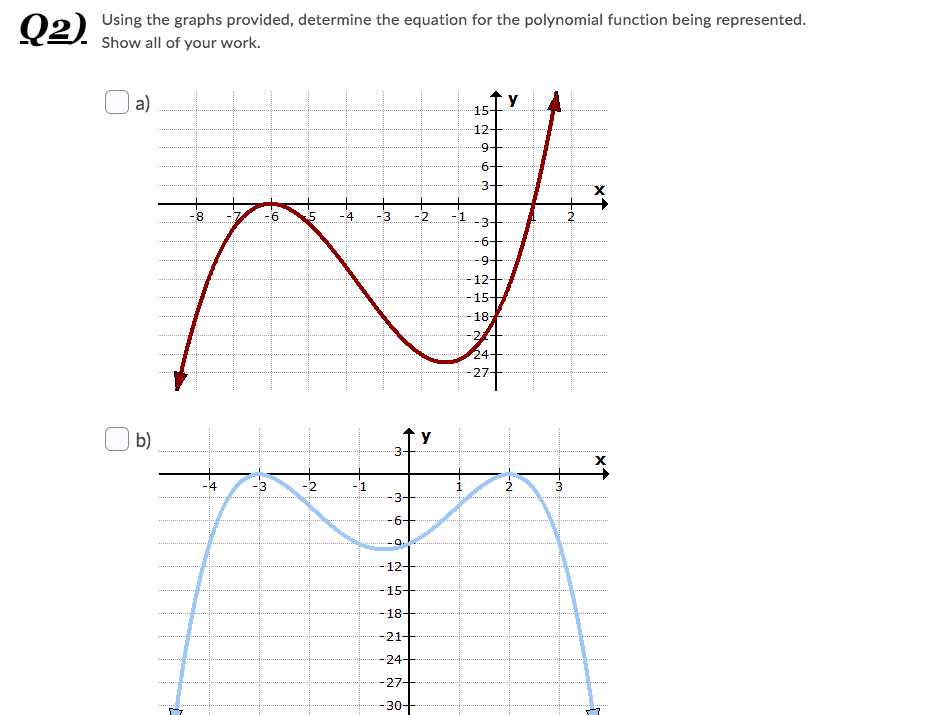
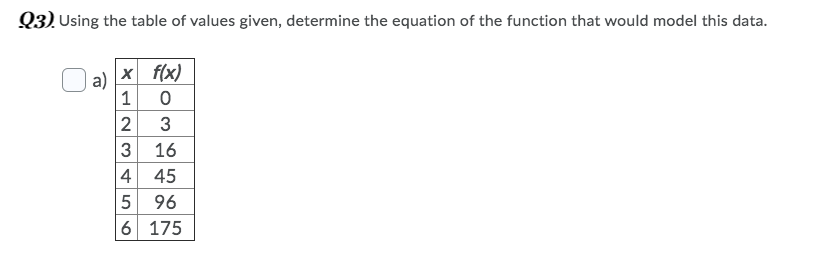
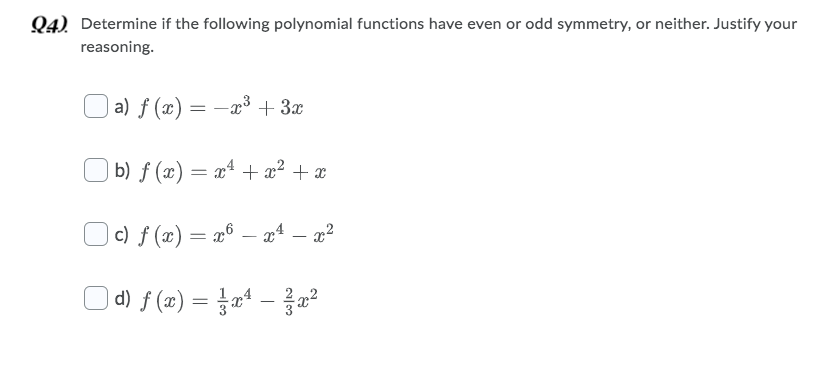
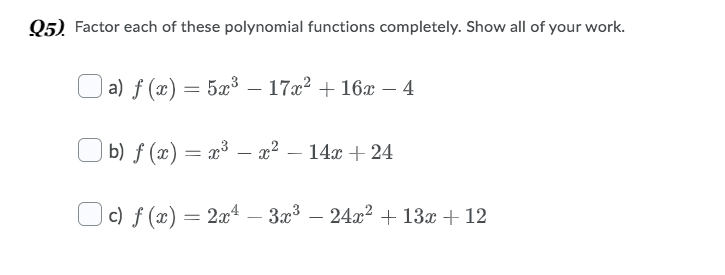
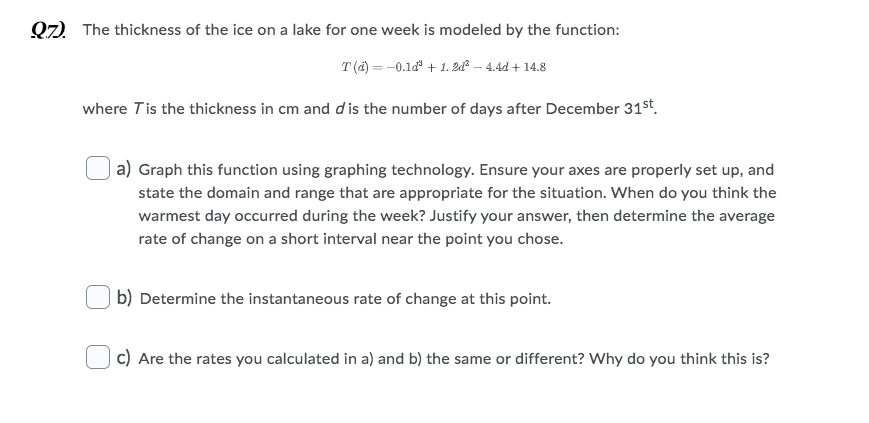
Q1 ' Without graphing, answer the following questions for each of the functions below: i. What are the end behaviours of this type of function [what quadrant does it begin and end in?) ii. What is the maximum and minimum number of Xintercepts for this type of function? iii. What is the maximum and minimum number of turns for this type of function? iv. State if there are any restrictions on the domain and range on this type of function. It may be easiest to format your answer by setting up a chart with the headings "End Behaviours, Maximum number of xintercepts. Minimum number of xintercepts, Maximum number of turns, Minimum number of turns, and Restrictions", then lling in your answers for the functions listed. Oa]f(m)=7$4+km3+8 Db)f(m)=%$3+4mzm Oc)f(m)=ml+km4+7 Q2 Using the graphs provided. determine the equation for the polynomial function being represented. - - Show all of your work. C] a] Q3). Using the table of values given, determine the equation of the function that would model this data. a ) X f(x) 1 O 2 3 3 16 4 45 5 96 6 17594) Determine if the following polynomial functions have even or odd symmetry, or neither. Justify your reasoning. Q5). Factor each of these polynomial functions completely. Show all of your work. (a) f(a) = 523 - 17x + 162 -4 (b) f (2) = 23 - 202 - 14a + 24 Oc) f(2) = 2x4 -3203 - 24x2 + 13x + 12Q Using what you have learned in this unit, solve the following problem: [:J The profit of a company can be modelled by the polynomial function Pm t3 +123?z 21s+ 10. where P is the profit. in thousands of dollars, and tis the time, in years. When will the company make their maximum profit of $108 000? 92] The thickness of the ice on a lake for one week is modeled by the function: Tiaj 0.1d" + 1. 2.13 4.4,i+14.8 where Tis the thickness in cm and dis the number of days after December 31\". [:J 3] Graph this function using graphing technology. Ensure your axes are properly set up, and state the domain and range that are appropriate for the situation. When do you think the warmest day occurred during the week? Justify your answer. then determine the average rate of change on a short interval near the point you chose. [:J b] Determine the instantaneous rate of change at this point. C] C) Are the rates you calculated in a] and h} the same or different? Why do you think this is
