

Question
Hello Statisticians, I am stuck with my statistics research assignment. For my scenario, I am tracking specific bird sitings for every month between the year
Hello Statisticians,
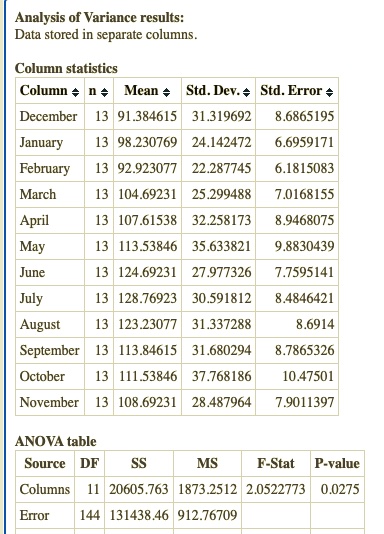
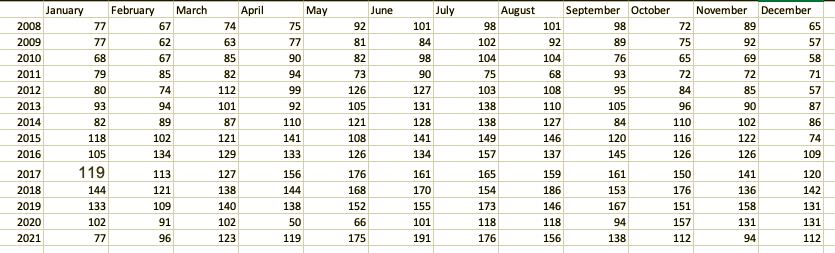
I am stuck with my statistics research assignment. For my scenario, I am tracking specific bird sitings for every month between the year 2008 and 2020. I am attempting to see if there is a difference (or increase) in the amount of bird sitings in certain months of the year.
My question is... Would it be better to use a One-Way Anova test or the non-parametric Kruskal-Wallis test to exam this? Or are both tests not appropriate for this situation?
Here is my raw data and the results (of the initial ANVOA run)
Step by Step Solution
There are 3 Steps involved in it
Step: 1

Get Instant Access to Expert-Tailored Solutions
See step-by-step solutions with expert insights and AI powered tools for academic success
Step: 2

Step: 3
Ace Your Homework with AI
Get the answers you need in no time with our AI-driven, step-by-step assistance
Get Started
Elementary Algebra
Authors: Charles P McKeague
2nd Edition
1483263819, 9781483263816