Hello, the following screenshot contains a linear regression stats question I don't know how to answer. The question asks for the estimated gradient of a
Hello, the following screenshot contains a linear regression stats question I don't know how to answer. The question asks for the estimated gradient of a dataset which they provide in an excel file. The excel file also contains the regression analysis for that dataset, I thought the answer was the cell I highlighted in yellow however it was marked wrong and I was hoping someone could help me. The first screenshot is the question, the second is the dataset, and the second is the regression analysis for the dataset.
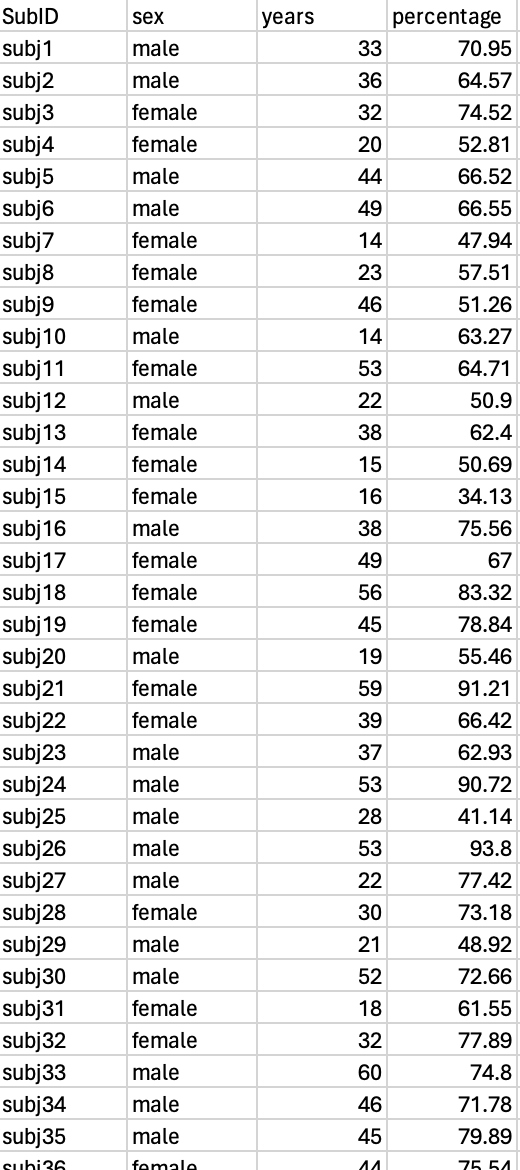
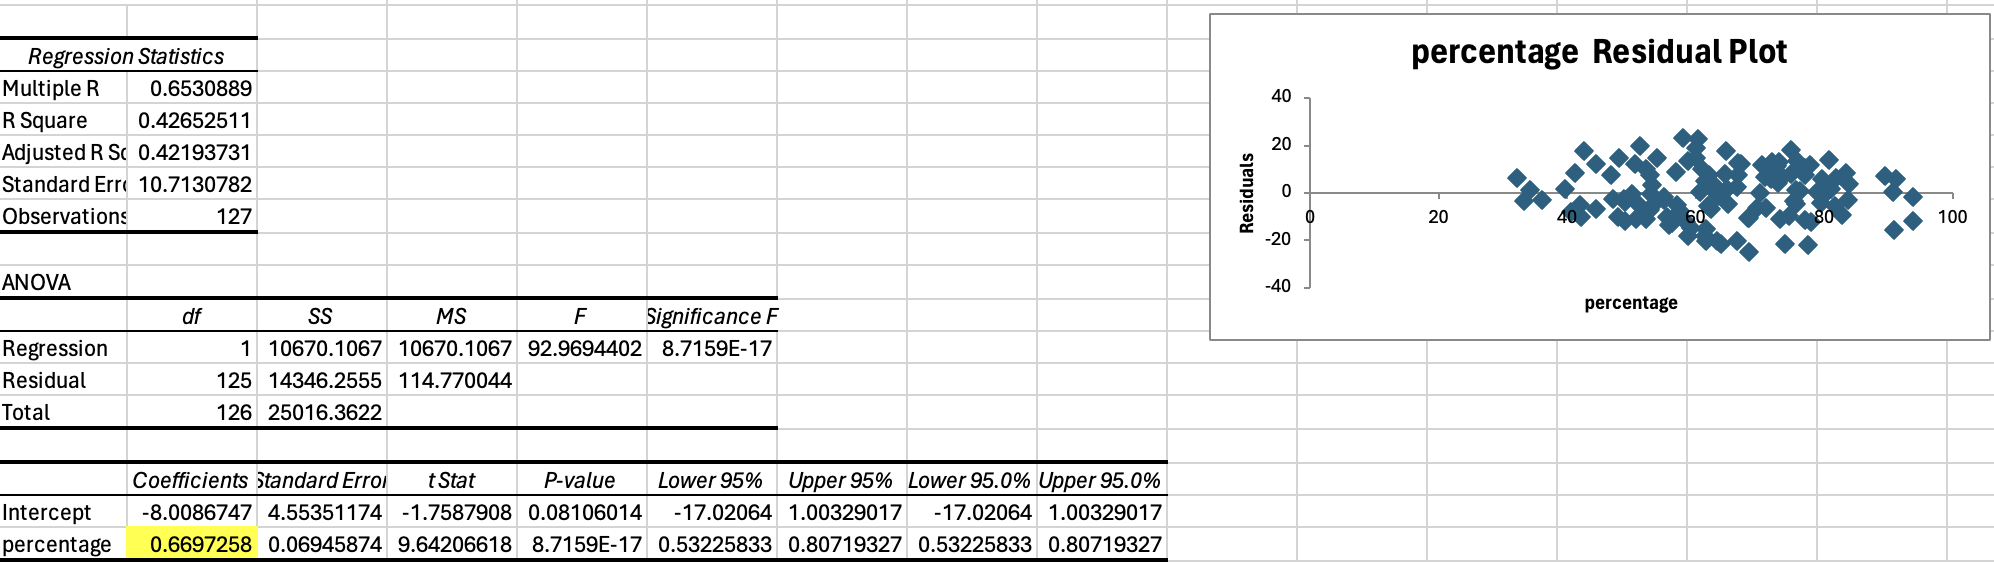
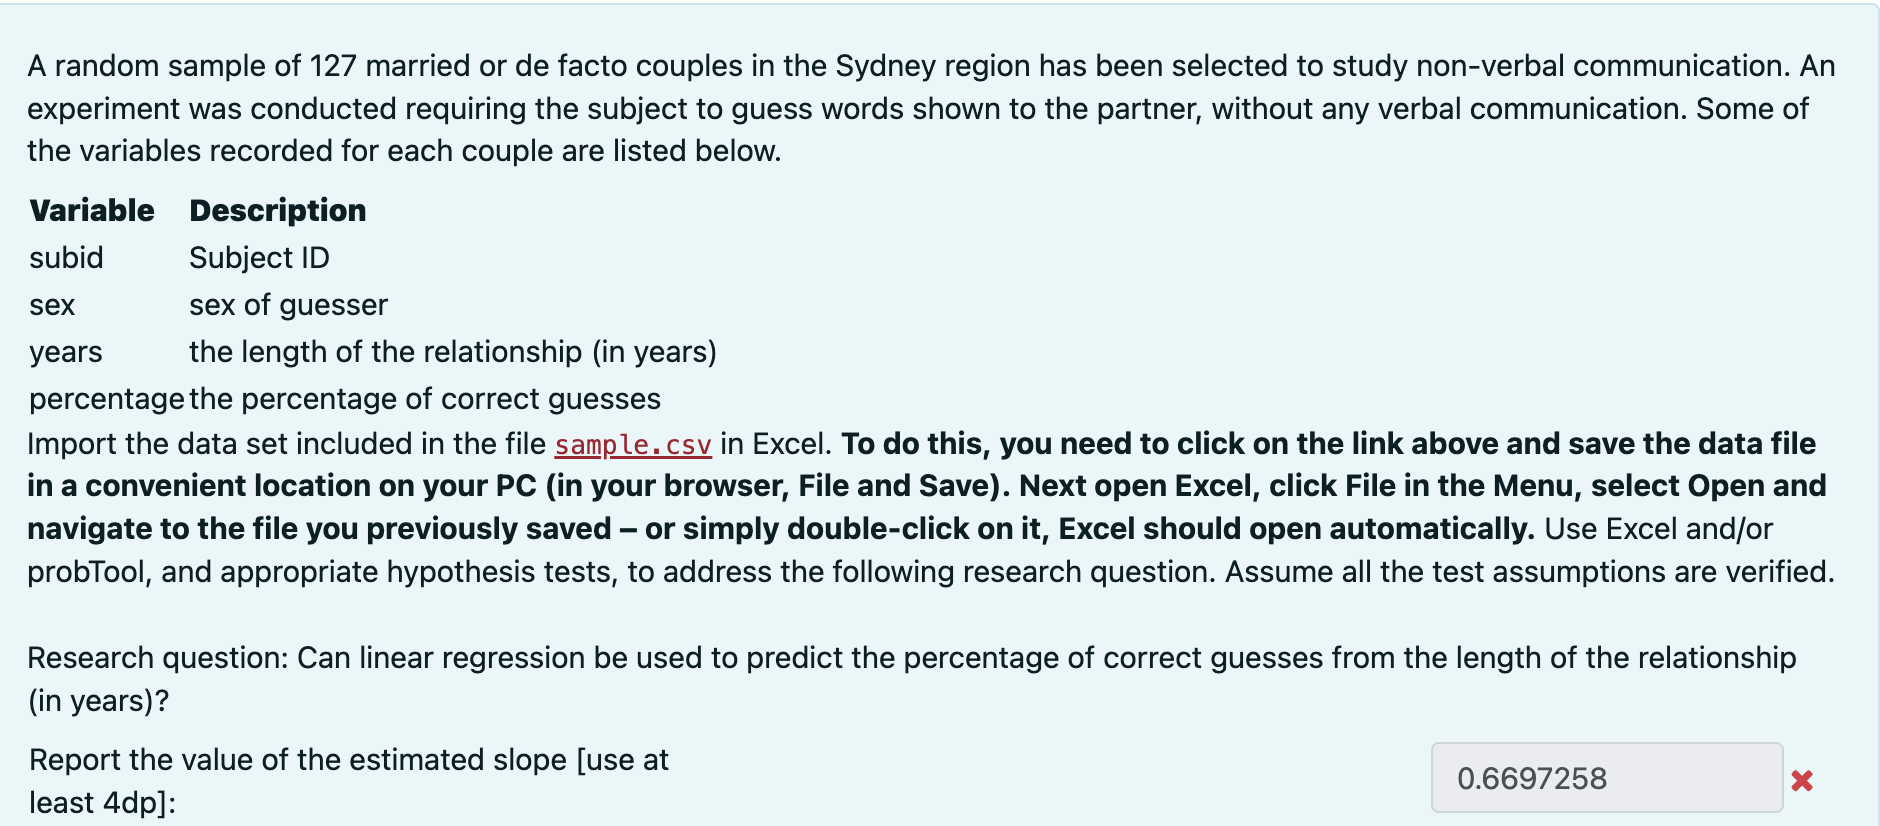
SubID sex years percentage subj 1 male 33 70.95 subj2 male 36 64.57 subj3 female 32 74.52 subj4 female 20 52.81 subj5 male 44 66.52 subj6 male 49 66.55 subj7 female 14 47.94 subj8 female 23 57.51 subj9 female 46 51.26 subj10 male 14 63.27 subj 11 female 53 64.71 subj 12 male 22 50.9 subj13 female 38 62.4 subj 14 female 15 50.69 subj 15 female 16 34.13 subj 16 male 38 75.56 subj17 female 49 67 subj 18 female 56 83.32 subj 19 female 45 78.84 subj20 male 19 55.46 subj21 female 59 91.21 subj22 female 39 66.42 subj23 male 37 62.93 subj24 male 53 90.72 subj25 male 28 41.14 subj26 male 53 93.8 subj27 male 22 77.42 subj28 female 30 73.18 subj29 male 21 48.92 subj30 male 52 72.66 subj31 female 18 61.55 subj32 female 32 77.89 subj33 male 60 74.8 subj34 male 46 71.78 subj35 male 45 79.89 cubic 76 51Regression Statistics percentage Residual Plot Multiple R 0.6530889 40 R Square 0.42652511 Adjusted R S( 0.42193731 20 Standard Err( 10.7130782 O Residuals Observations 127 -O 20 100 -20 ANOVA -40 df SS MS F Significance F percentage Regression 1 10670.1067 10670.1067 92.9694402 8.7159E-17 Residual 125 14346.2555 114.770044 Total 126 25016.3622 Coefficients Standard Error t Stat P-value Lower 95% Upper 95% Lower 95.0% Upper 95.0% Intercept -8.0086747 4.55351174 -1.7587908 0.08106014 -17.02064 1.00329017 -17.02064 1.00329017 percentage 0.6697258 0.06945874 9.64206618 8.7159E-17 0.53225833 0.80719327 0.53225833 0.80719327A random sample of 127 married or de facto couples in the Sydney region has been selected to study non-verbal communication. An experiment was conducted requiring the subject to guess words shown to the partner, without any verbal communication. Some of the variables recorded for each couple are listed below. Variable Description subid Subject ID sex sex of guesser years the length of the relationship (in years) percentage the percentage of correct guesses Import the data set included in the file sample.csv in Excel. To do this, you need to click on the link above and save the data file in a convenient location on your PC (in your browser, File and Save). Next open Excel, click File in the Menu, select Open and navigate to the file you previously saved - or simply double-click on it, Excel should open automatically. Use Excel and/or probTool, and appropriate hypothesis tests, to address the following research question. Assume all the test assumptions are verified. Research question: Can linear regression be used to predict the percentage of correct guesses from the length of the relationship (in years)? Report the value of the estimated slope [use at 0.6697258 x least 4dp]
Step by Step Solution
There are 3 Steps involved in it
Step: 1
Get Instant Access to Expert-Tailored Solutions
See step-by-step solutions with expert insights and AI powered tools for academic success
Step: 2
Step: 3
Ace Your Homework with AI
Get the answers you need in no time with our AI-driven, step-by-step assistance