

Question
Hello tutor, using the instructions/data set below could you assist me in answering question 1 to 8. Thank you Instructions An experiment was conducted on
Hello tutor, using the instructions/data set below could you assist me in answering question 1 to 8. Thank you
Instructions
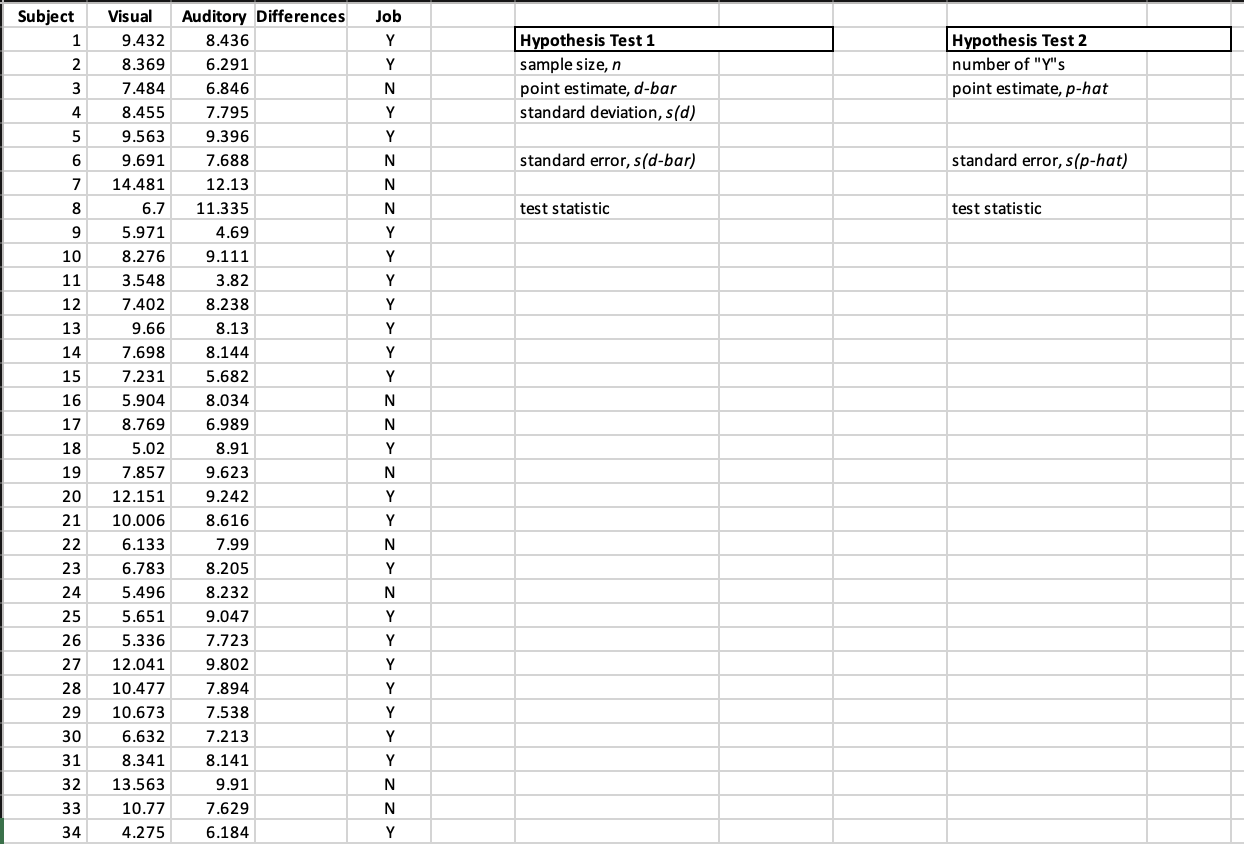
An experiment was conducted on randomly selected Fraser students: each student sees a photo of an object (visual) and then identifies the object, and each student hears a sound (auditory) and then identifies the sound.
The following are instructions to conduct two different hypothesis tests; the first (#s 1-8) is about the population mean difference (??) between visual and auditory response time, and the second (#s 9-16) is about the population proportion (?) of Student students who have jobs.
For Problems 1 - 8: A researcher claims that the response time for visual stimuli, in milliseconds, is greater than the response time for auditory stimuli, on average. Use the sample information to test if there is evidence, at ? = 0.1, that supports the researcher's claim.
1. Define the parameter
2. State the hypotheses for this test.
- In Column D, Revise a new data set for the differences in response times: Differences = Visual - Auditory In Cell D2 type: =B2-C2 to calculate the difference of Visual and Auditory response times for Subject 1. Use the fill handle to calculate the remaining differences for all n subjects.
3. Compute the test statistic using Excel.
- State the name of the test statistic and type the work (using values rounded to 3 decimals and parentheses to show order of operations); then give the computed value to 2 decimals.(2 points)
4. Find the p-value from a table using the test statistic.
- Type the probability statement for the p-value and the probability, or range of probability, found using the table (z or t table).
5. The Data Analysis ToolPak in Excel has a paired t-test.
- Go to the "Data" Tab and click "Data Analysis". Select "t-Test: Paired Two Sample for Means". In the Variable 1 Range field: select the Visual data - including the "Visual" label In the Variable 2 Range field: select the Auditory data - including the "Auditory" label Enter the hypothesized value for the mean (from #2); Check the Labels box; Enter alpha of 0.1; Select "Output Range" and enter M12 in the field Click OK. Double click on the vertical line between M & N to resize the table for easier reading
- Copy and paste the output from M2:O15
6. Type the p-value exactly as provided in the output for "t-Test: Paired Two Sample for Means"; there are two p-values (probabilities) provided: one-tailed and two-tailed, select the one that is for your hypothesis from #2.
- Hint: the value should agree with the p-value you found in #4.
7. Type the critical value(s) for the rejection region for this test
8. After comparing the p-value to ?, or the test statistic to the critical value, type the conclusion.
Date set:
| Subject | Visual | Auditory | Differences | Job | ||||||
| 1 | 9.432 | 8.436 | Y | Hypothesis Test 1 | Hypothesis Test 2 | |||||
| 2 | 8.369 | 6.291 | Y | sample size, n | number of "Y"s | |||||
| 3 | 7.484 | 6.846 | N | point estimate, d-bar | point estimate, p-hat | |||||
| 4 | 8.455 | 7.795 | Y | standard deviation, s(d) | ||||||
| 5 | 9.563 | 9.396 | Y | |||||||
| 6 | 9.691 | 7.688 | N | standard error, s(d-bar) | standard error,s(p-hat) | |||||
| 7 | 14.481 | 12.13 | N | |||||||
| 8 | 6.7 | 11.335 | N | test statistic | test statistic | |||||
| 9 | 5.971 | 4.69 | Y | |||||||
| 10 | 8.276 | 9.111 | Y | |||||||
| 11 | 3.548 | 3.82 | Y | |||||||
| 12 | 7.402 | 8.238 | Y | |||||||
| 13 | 9.66 | 8.13 | Y | |||||||
| 14 | 7.698 | 8.144 | Y | |||||||
| 15 | 7.231 | 5.682 | Y | |||||||
| 16 | 5.904 | 8.034 | N | |||||||
| 17 | 8.769 | 6.989 | N | |||||||
| 18 | 5.02 | 8.91 | Y | |||||||
| 19 | 7.857 | 9.623 | N | |||||||
| 20 | 12.151 | 9.242 | Y | |||||||
| 21 | 10.006 | 8.616 | Y | |||||||
| 22 | 6.133 | 7.99 | N | |||||||
| 23 | 6.783 | 8.205 | Y | |||||||
| 24 | 5.496 | 8.232 | N | |||||||
| 25 | 5.651 | 9.047 | Y | |||||||
| 26 | 5.336 | 7.723 | Y | |||||||
| 27 | 12.041 | 9.802 | Y | |||||||
| 28 | 10.477 | 7.894 | Y | |||||||
| 29 | 10.673 | 7.538 | Y | |||||||
| 30 | 6.632 | 7.213 | Y | |||||||
| 31 | 8.341 | 8.141 | Y | |||||||
| 32 | 13.563 | 9.91 | N | |||||||
| 33 | 10.77 | 7.629 | N | |||||||
| 34 | 4.275 | 6.184 | Y | |||||||
| 35 | 13.542 | 11.4 | Y | |||||||
| 36 | 5.579 | 8.677 | Y | |||||||
| 37 | 8.625 | 8.302 | Y | |||||||
| 38 | 9.707 | 10.218 | Y | |||||||
| 39 | 10.881 | 7.638 | N | |||||||
| 40 | 10.716 | 6.772 | Y | |||||||
| 41 | 10.063 | 7.035 | Y | |||||||
| 42 | 7.288 | 4.515 | N | |||||||
| 43 | 12.473 | 7.826 | Y | |||||||
| 44 | 9.728 | 8.859 | N | |||||||
| 45 | 7.53 | 10.824 | Y | |||||||
| 46 | 11.209 | 10.585 | Y | |||||||
| 47 | 3.802 | 7.004 | N | |||||||
| 48 | 11.68 | 9.936 | Y | |||||||
| 49 | 8.193 | 9.182 | Y | |||||||
| 50 | 10.603 | 8.099 | Y | |||||||
| 51 | 10.692 | 9.078 | N | |||||||
| 52 | 8.158 | 9.046 | N | |||||||
| 53 | 7.683 | 6.357 | N | |||||||
| 54 | 9.738 | 10.944 | Y | |||||||
| 55 | 8.688 | 7.476 | N | |||||||
| 56 | 12.766 | 8.961 | Y | |||||||
| 57 | 5.874 | 9.105 | Y | |||||||
| 58 | 6.129 | 8.754 | Y | |||||||
| 59 | 11.699 | 9.144 | N | |||||||
| 60 | 13.598 | 11.03 | N | |||||||
| 61 | 10.781 | 8.804 | Y | |||||||
| 62 | 8.709 | 5.535 | N | |||||||
| 63 | 14.411 | 10.592 | Y | |||||||
| 64 | 9.484 | 7.051 | Y | |||||||
| 65 | 7.452 | 8.75 | Y | |||||||
| 66 | 9.673 | 10.078 | N | |||||||
| 67 | 4.267 | 7.578 | Y | |||||||
| 68 | 8.271 | 6.638 | N | |||||||
| 69 | 12.287 | 10.611 | Y | |||||||
| 70 | 7.456 | 7.744 | Y | |||||||
| 71 | 1.938 | 9.048 | Y | |||||||
| 72 | 11.621 | 10.118 | Y | |||||||
| 73 | 10.095 | 7.099 | Y | |||||||
| 74 | 6.182 | 3.668 | Y | |||||||
| 75 | 12.076 | 9.476 | N | |||||||
| 76 | 10.927 | 9.462 | Y | |||||||
| 77 | 9.672 | 9.718 | Y | |||||||
| 78 | 10.039 | 6.728 | Y | |||||||
| 79 | 11.974 | 9.573 | Y | |||||||
| 80 | 10.206 | 8.41 | Y |

Step by Step Solution
There are 3 Steps involved in it
Step: 1

Get Instant Access to Expert-Tailored Solutions
See step-by-step solutions with expert insights and AI powered tools for academic success
Step: 2

Step: 3
Ace Your Homework with AI
Get the answers you need in no time with our AI-driven, step-by-step assistance
Get Started
Differential Equations and Linear Algebra
Authors: Jerry Farlow, James E. Hall, Jean Marie McDill, Beverly H. West
2nd edition
131860615, 978-0131860612