

Question
Hello tutors, I worked on this assignment, but need someone to verify if my work is correct. I was confused a bit and don't feel
Hello tutors, I worked on this assignment, but need someone to verify if my work is correct. I was confused a bit and don't feel as confident. Please see below. Thank you
11.13 Reread the problem described in Question 10.5 on page 191.
Progress Check *10.5 According to the American Psychological Association, members with a doctorate and a full-time teaching appointment earn, on the average, $82,500 per year, with a standard deviation of $6,000. An investigator wishes to determine whether $82,500 is also the mean salary for all female members with a doctorate and a full-time teaching appoint-ment. Salaries are obtained for a random sample of 100 women from this population, and the mean salary equals $80,100.
What form should H0 and H1 take if the investigator is concerned only about salarydiscrimination against female members?
a)Ho: = 82,500, Ha:
We want to know if a female with a PhD and a full-time teaching position makes less than 82,500 per year. In light of this, we're testing the claim to determine if the alternate hypothesis is correct.
b) If this hypothesis test supports the conclusion of salary discrimination against female members, a costly class-action suit will be initiated against American colleges and universities. Under these circumstances, do you recommend using the .05 or the .01 level of significance? Why
Any extra measures that might prevent errors should be taken. As a result, it is recommended that a 0.01 level of significance be utilized since it is more sensitive and decreases the likelihood of error.
11.19 How should a projected hypothesis test be modified if you're particularly concerned about
(a) the type I error?
Use confidence intervals, and lower levels of significance to avoid errors.
Treat data neutrally.
(b) the type II error?
Use a larger sample size to avoid type II errors and confidence intervals.
Treat data neutrally.
12.8 In Review Question 11.12 on page 218, instead of testing a hypothesis, you might prefer to construct a confidence interval for the mean weight of all 2-pound boxes of candy during a recent production shift.
11.12 A production line at a candy plant is designed to yield 2-pound boxes of assorted candies whose weights in fact follow a normal distribution with a mean of 33 ounces and a standard deviation of .30 ounce. A random sample of36 boxesfrom the production of the most recent shift reveals amean weight of 33.09 ounces. (Incidentally, if you think about it, this is an exception to the usual situation where the investigator hopes to reject the null hypothesis.)
SEE ATTACHMENT - UNABLE TO PASTE FORMAT.
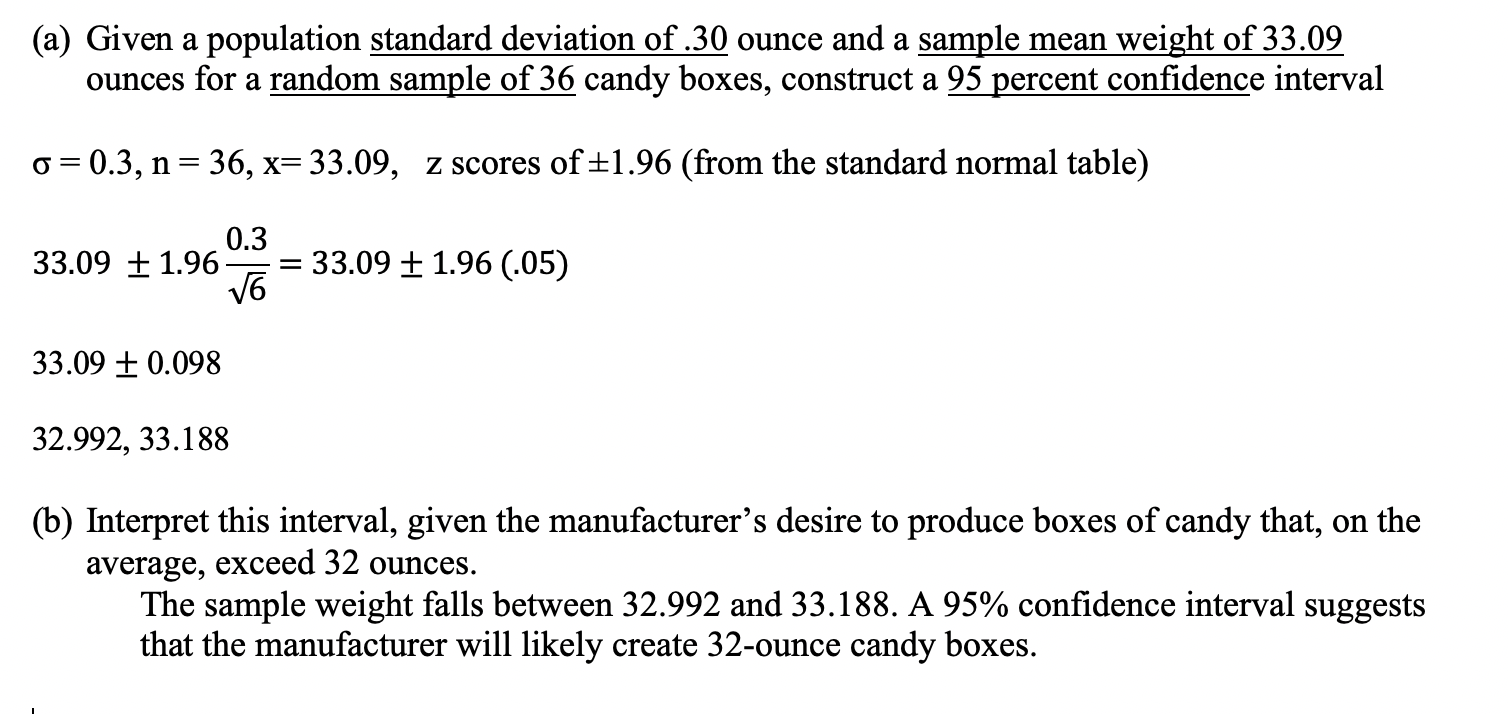
(a)Given a populationstandard deviation of .30ounce and asample mean weight of 33.09ounces for arandom sample of 36candy boxes, construct a95 percent confidence interval
33.090.098
32.992, 33.188
(b)Interpret this interval, given the manufacturer's desire to produce boxes of candy that, on the average, exceed 32 ounces.
The sample weight falls between 32.992 and 33.188. A 95% confidence interval suggests that the manufacturer will likely create 32-ounce candy boxes.
Step by Step Solution
There are 3 Steps involved in it
Step: 1

Get Instant Access to Expert-Tailored Solutions
See step-by-step solutions with expert insights and AI powered tools for academic success
Step: 2

Step: 3
Ace Your Homework with AI
Get the answers you need in no time with our AI-driven, step-by-step assistance
Get Started