

Answered step by step
Verified Expert Solution
Question
1 Approved Answer
Hello, Would you please help me with this question? I know how to do 1 but not 2-4. I included one part of the data
Hello,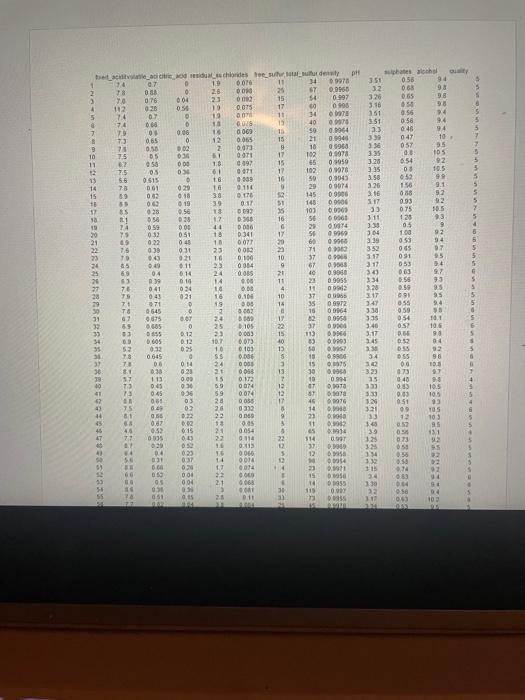
Would you please help me with this question? I know how to do 1 but not 2-4. I included one part of the data provided for context, it is really long so it is ok to just know how to code these in SAS and how to explain and interpret output. Thank you in advance! Will rate! :) 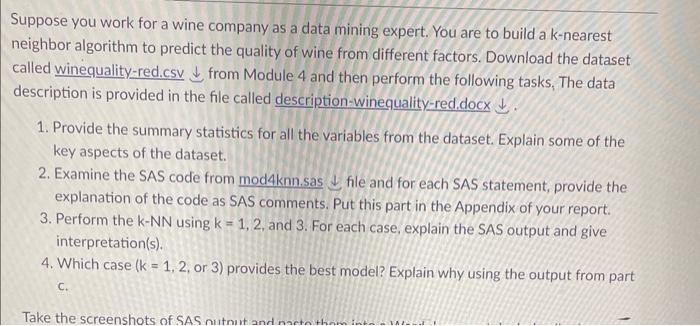
this is the data piece :
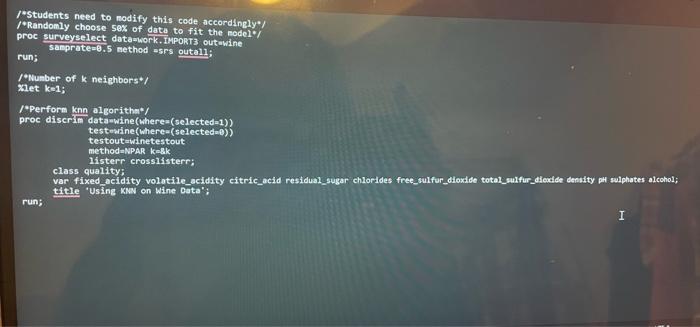
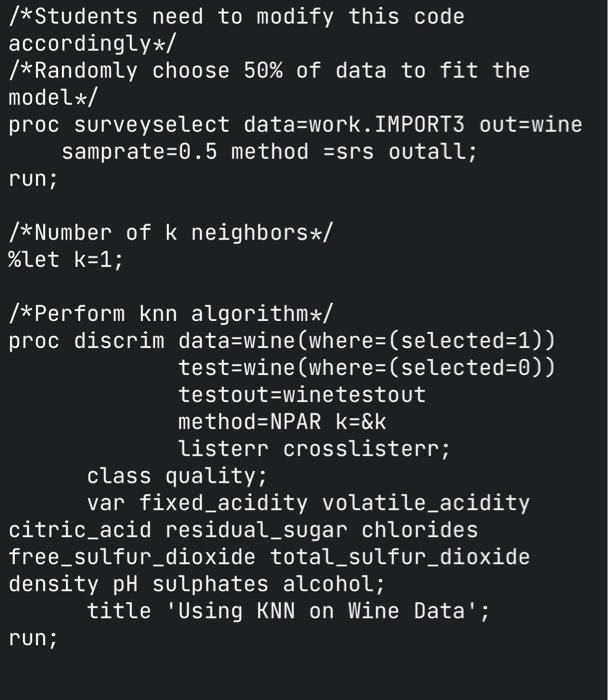
this is the code mentioned in 2:
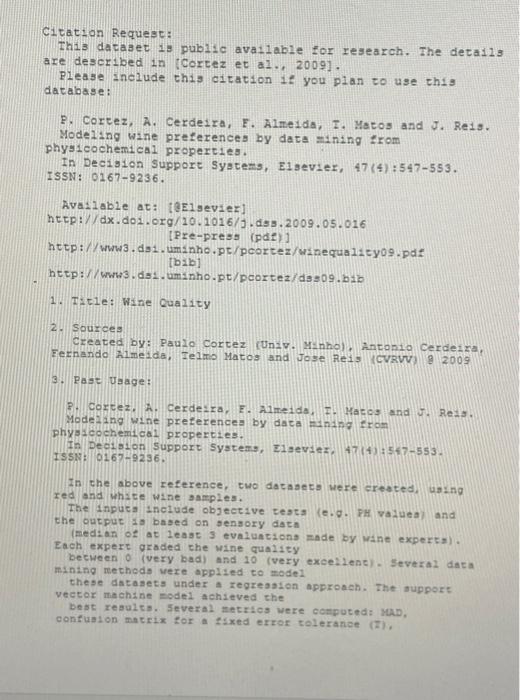
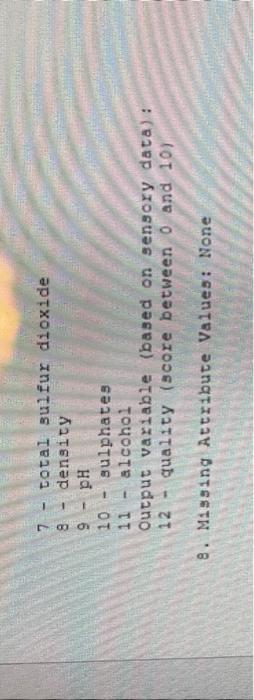
this is the description csv:
Hello, 
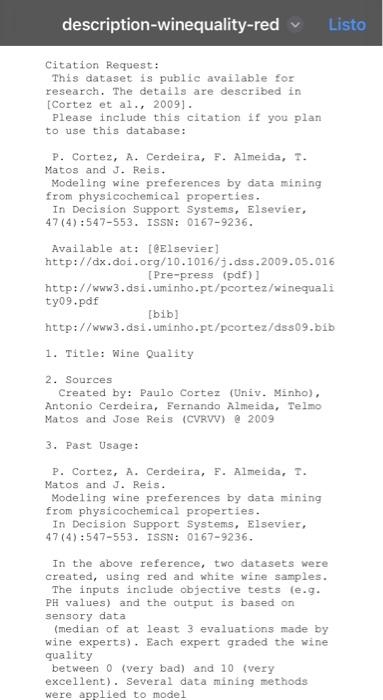
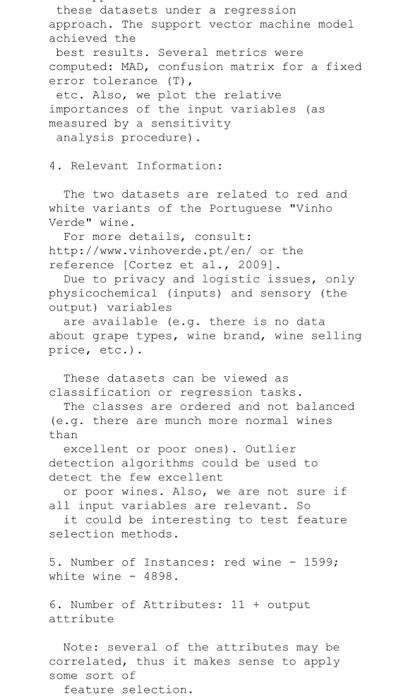
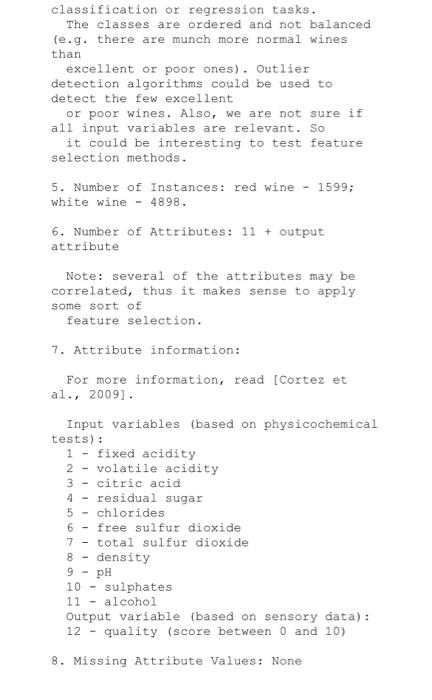
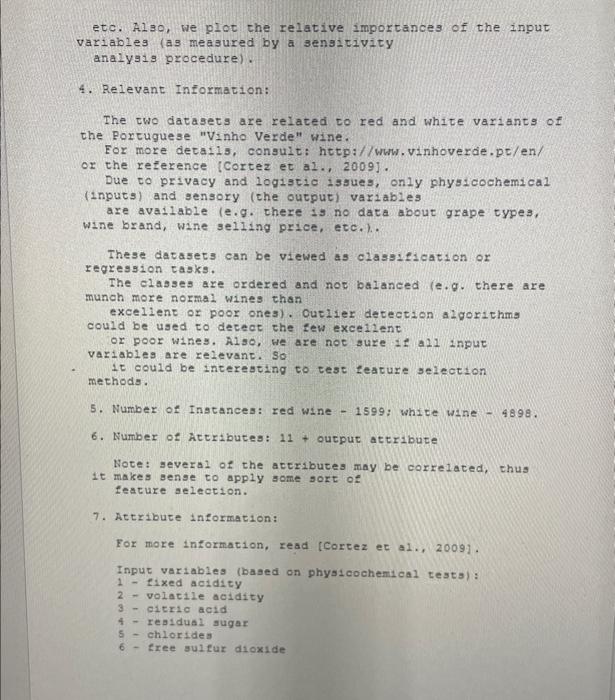
Suppose you work for a wine company as a data mining expert. You are to build a k-nearest neighbor algorithm to predict the quality of wine from different factors. Download the dataset called winequality-red.csv from Module 4 and then perform the following tasks, The data description is provided in the file called description-winequality-red.docx . 1. Provide the summary statistics for all the variables from the dataset. Explain some of the key aspects of the dataset. 2. Examine the SAS code from mod 4knn.sas file and for each SAS statement, provide the explanation of the code as SAS comments. Put this part in the Appendix of your report. 3. Perform the kNN using k=1,2, and 3. For each case, explain the SAS output and give interpretation(s). 4. Which case (k=1,2, or 3) provides the best model? Explain why using the output from part c. fistudents need to nodify this code accordingly*/ f*Randomly choose 5ex of data to fit the nodel*f proc surveyselect datamork. IMPORT out wine run; samprate=g.5 method =sFs outall; f *Nunber of k neighbors xiet ket ? foperform knn algorithm*f proc discrin dataswine(where-(selected=1)) testowine (where-(selectedog)) testout=winetestout method =NPARkagk Listerr crossilisterr; class quality; var_fixed acidity volatile_acidity citric_acid residual_sugar chlorides free_sulfur_dioxide total_sulfur_diedide dendty pH sulphates alcohol; title "Using KNE on Wine Oata": Cication Request: This dacaaet 1 a pub11c ava11able for research. The deta113 are described in tCortez et a1., 20091. Please include chis citation if you plan co use chis dacabase: P. Corcez, A. Cerdeira, F. Alme1da, T. Macos and J. Re1s. Modeling wine preferences by data mining from physicochemical properties. In Decision Support Syatezs, Elsevier, 47(4):547553. ISSN: 01679236. Avallable at: [gelseviez] htcp://dx.do1.org/10.1016/1.dss.2009.05.016 [Pre-press (pde)] hetp://wwa.da1. uminho.pt/pcortez/winequa1ityog.pde [b1b ] hetp: // Wwa3. ds1. uminho.pt/pcortez/dssog.blb 1. Titie: Wine Qualicy 2. Sources Created by: Paulo Cortez (Jnzp. Munho). Antonso Cerdeiza, Feznando Almeida, Telmo Macos and Joge Reis (CVRVV) 92009 3. Rast Yaage: 8. Corcez. A. Cerdezra, E. Almeida, F. Hacos and U. Rezy. Modeding wine preferencea by daca mining from phys1cochemical properties. In Decision Support Systeme, Dlseviez, 47 (4):567553. ISSN: 01679236 . In the above reference, two datasecs were creaced, uaing red and white wine aamples. The inputa inctude objective ceats (e.g. iH vajuea) and the oucpuc is based on sensory data (median of at least 3 evaluations made by wane experts). Each expert graded the wine quality becween 0 (very bad) and 10 (very exceslene). Several data mining methods vere applied to model these datasets under a regreagien approach. The support vector machine model achieved che best reaults. Several metrics were conputedi MAD, confualon matrix tor a fixed error telerance (I). etc. Alao, we plot the relative importances of the input variables (as measured by a sensitivity analyais procedurel. 4. Relevant Information: The two datasets are related to red and white variants of the Portuguese "Vinho Verde" wine. For more deta11s, conault: hetp://ww.vinhoverde.pt/en/ or the reference [Cortez et al., 2009]. Due to privacy and logistio issues, only physicochemical (1nputs) and sensory (che output) variables are available (e.g. chere is. no data about grape types, wine brand, wine seliing price, etc.). These datasets can be viewed as classieication or regression casks. The classes are ordered and not balaneed (e. g. there are munch more normal wines than excelient of poor ones). Outlier detection algorithms could be used to deceot the few exce1lent or poor wines. Also, we are not aure if al1 inple variables are relevanc. S0 it could be interesting to test feature selection methods. 5. Number of Instances: red wine - 1599; white wine - 4898 . 6. Number of Attributes: 11+ outpuc attribute Note: several of the actributes may be correlated, thus 1t makes senge to apply aome sort of feacure aelection. 7. Attribute information: For more information, read fCortez et a1., 20091. Input variables (baaed on physicochemical tests): 1. tixed acidity 2 - volatile aeidity 3. citric acid 4 - reaidual sugar 5 - chlorides 6 - tree sulfur dioxide 7 - total sulfur dioxide 8 - density 9pH 10 - sulphates 11 - alcohol Output variable (based on gensory daca): 12 - quality (score between 0 and 10) 8. Missing Attribute Values: None different factors. Download the dataset called winequality-red.csv from Module 4 and then perform the following tasks. The data description is provided in the file called description-winequalityred.docx . 1. Provide the summary statistics for all the variables from the dataset. Explain some of the key aspects of the dataset. file and for each SAS statement, provide the explanation of the code as SAS comments. Put this part in the Appendix of your report. 3. Perform the kNN using k=1,2, and 3 . For each case, explain the SAS output and give interpretation(s). 4. Which case (k=1,2, or 3) provides the best model? Explain why using the output from part c. Do /*Students need to modify this code accordingly*/ /*Randomly choose 50% of data to fit the model*/ proc surveyselect data=work. IMPORT3 out=wine samprate=0.5 method =srs outall; run; /*Number of k neighbors*/ \%let k=1; /*Perform knn algorithm*/ proc discrim data=wine(where=(selected=1)) test=wine(where=(selected=0)) testout=winetestout method=NPAR k=\&k cisterr crosslisterr; citric_acid residual_sugar chlorides free_sulfur_dioxide total_sulfur_dioxide density pulphates alcohol; title 'Using KNN on Wine Data'; Citation Request: This dataset is public available for research. The details are described in [Cortez et al., 2009]. Please include this citation if you plan to use this database: P. Cortez, A. Cerdeira, F. Almeida, I. Matos and J. Reis. Modeling wine preferences by data mining from physicochemical properties. In Decision Support Systems, Elsevier, 47(4):547553. ISSN: 0167-9236. Available at: [Qelsevier] http://dx. doi.org/10.1016/j.dss.2009.05.016 [Pre-press (pdf)] http;//www 3.dsi , uminho.pt/pcortez/winequali ty09,pdf [bib] 1. Title: Wine Quality 2. Sources Created by: Paulo Cortez (Univ. Minho), Antonio Cerdeira, Fernando Almeida, Telmo Matos and Jose Reis (CVRVV) e 2009 3. Past Usage: P. Cortez, A. Cerdeira, F. Almeida, T. Matos and J. Reis. Modeling wine preferences by data mining from physicochemical properties. In Decision Support Systems, Elsevier, 47(4):547553. ISSN: 0167-9236. In the above reference, two datasets were created, using red and white wine samples. The inputs include objective tests (e.g. PH values) and the output is based on sensory data (median of at least 3 evaluations made by wine experts). Each expert graded the wine quality between 0 (very bad) and 10 (very excellent). Several data mining methods were applied to model these datasets under a regression approach. The support vector machine model achieved the best results. Several metrics were computed: MaD, confusion matrix for a fixed error tolerance (T), etc. Also, we plot the relative importances of the input variables (as measured by a sensitivity analysis procedure). 4. Relevant Information: The two datasets are related to red and white variants of the Portuguese "Vinho Verde" wine. For more details, consult: http://ww.vinhoverde.pt/en/ or the reference [Cortez et al., 2009], Due to privacy and logistic issues, only physicochemical (inputs) and sensory (the output) variables are available (e.g. there is no data about grape types, wine brand, wine selling price, etc.). These datasets can be viewed as classification or regression tasks. The classes are ordered and not balanced (e.g. there are munch more normal wines than excellent or poor ones). Outlier detection algorithms could be used to detect the few excellent or poor wines. Also, we are not sure if all input variables are relevant. So it could be interesting to test feature selection methods. 5. Number of Instances: red wine - 1599; white wine - 4898 . 6. Number of Attributes: 11+ output attribute Note: several of the attributes may be correlated, thus it makes sense to apply some sort of feature selection. classification or regression tasks. The classes are ordered and not balanced (e.g. there are munch more normal wines than excellent or poor ones). Outlier detection algorithms could be used to detect the few excellent or poor wines. Also, we are not sure if all input variables are relevant. So it could be interesting to test feature selection methods. 5. Number of Instances: red wine - 1599; white wine - 4898 . 6. Number of Attributes: 11 + output attribute Note: several of the attributes may be correlated, thus it makes sense to apply some sort of feature selection. 7. Attribute information: Output variable (based on sensory data): For more information, read [Cortez et al. 2009 ]. testality (score between o and 10 ) Input variables (based on physicochemical 1 - fixed acidity 2 - volatile acidity 3 - citric acid 4 - residual sugar 5 - chlorides 6 - free sulfur dioxide 7 - total sulfur dioxide 8 - density 9 - ph Thank you for helping me. I will provide clearer images:
This is the prompt:
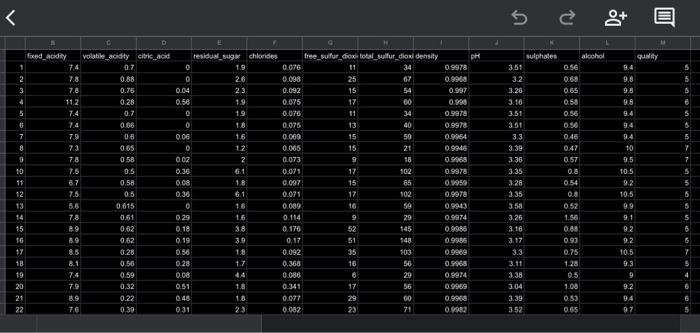
This are the variables in winequality-red.csv for context. I cannot provide all of the information because it has more than 1000 cells:
This is the code mentioned in #2
This is the Data Description mentioned in the prompt:
Step by Step Solution
There are 3 Steps involved in it
Step: 1

Get Instant Access to Expert-Tailored Solutions
See step-by-step solutions with expert insights and AI powered tools for academic success
Step: 2

Step: 3
Ace Your Homework with AI
Get the answers you need in no time with our AI-driven, step-by-step assistance
Get Started
Databases In Telecommunications Ii Vldb 2001 International Workshop Dbtel 2001 Rome Italy September 10 2001 Proceedings Lncs 2209
Authors: Willem Jonker
2001st Edition
354042623X, 978-3540426233