Help
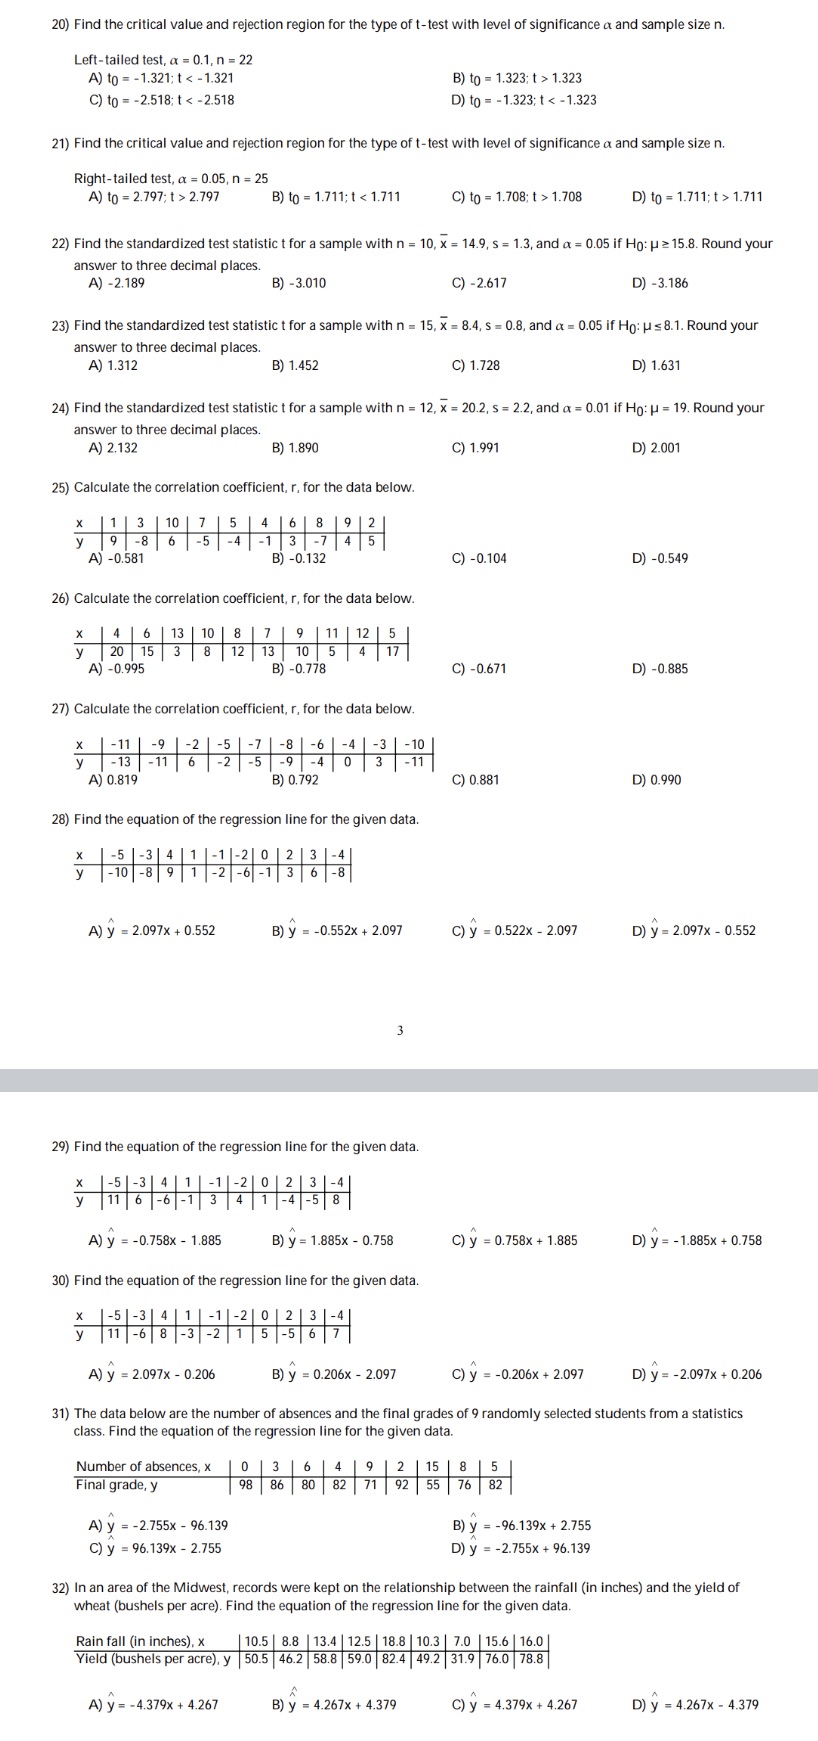
20) Find the critical value and rejection region for the type of t-test with level of significance a and sample size n. Left-tailed test, a = 0.1, n = 22 A) to = -1.321; t 1.323 C) to = -2.518; t 2.797 B) to = 1.711; t 1.708 D) to = 1.711; t > 1.711 22) Find the standardized test statistic t for a sample with n = 10, x = 14.9, s = 1.3, and a = 0.05 if Ho: H > 15.8. Round your answer to three decimal places. A) -2.189 B) -3.010 C) -2.617 D) -3.186 23) Find the standardized test statistic t for a sample with n = 15, x = 8.4, s = 0.8, and a = 0.05 if Ho: H s 8.1. Round your answer to three decimal places. A) 1.312 B) 1.452 C) 1.728 D) 1.631 24) Find the standardized test statistic t for a sample with n = 12, x = 20.2, s = 2.2, and a = 0.01 if Ho: H = 19. Round your answer to three decimal places. A) 2.132 B) 1.890 C) 1.991 D) 2.001 25) Calculate the correlation coefficient, r, for the data below. 13 10 7 5 4 6 8 9 2 y 9 -8 6 -5 -4 -1 3 -7 4 5 A) -0.581 B) -0.132 C) -0.104 D) -0.549 26) Calculate the correlation coefficient, r, for the data below. 4 6 13 10 8 7 9 11 12 5 y 20 15 3 8 12 13 10 5 4 17 A) -0.995 B) -0.778 C) -0.671 D) -0.885 27) Calculate the correlation coefficient, r, for the data below. -11 -9 -2 -5 -7 -8 -6 -4 -3 -10 y - 13 - 11 6 -2 -5 -9 -4 0 3 -11 A) 0.819 B) 0.792 C) 0.881 D) 0.990 28) Find the equation of the regression line for the given data. -5 -3 4 1 -1-20 2 3-4 y -10 - 8 9 1 - 2 - 6 - 1 3 6 - 8 A) y = 2.097x + 0.552 B) y = -0.552x + 2.097 C) y = 0.522x - 2.097 D) y = 2.097x - 0.552 29) Find the equation of the regression line for the given data. x -5 -3 4 1 -1 -2 0 2 3 -4 y 11 6 - 6 -1 3 4 1 - 4 -5 8 A) y = -0.758x - 1.885 B) y = 1.885x - 0.758 C) y = 0.758x + 1.885 D) y = -1.885x + 0.758 30) Find the equation of the regression line for the given data. 1-51 -3 4 1 -1 -20 2 3-4 y 11 -6 8 -3 - 2 1 5 - 5 6 7 A) y = 2.097x - 0.206 B) y = 0.206x - 2.097 C) y = -0.206x + 2.097 D) y = -2.097x + 0.206 31) The data below are the number of absences and the final grades of 9 randomly selected students from a statistics class. Find the equation of the regression line for the given data. Number of absences, x 0 3 6 4 9 2 15 8 5 Final grade, y 198 86 80 82 71 92 55 76 82 A) y = -2.755x - 96.139 B) y = -96.139x + 2.755 C) y = 96.139x - 2.755 D) y = -2.755x + 96.139 32) In an area of the Midwest, records were kept on the relationship between the rainfall (in inches) and the yield of wheat (bushels per acre). Find the equation of the regression line for the given data. Rain fall (in inches), x 10.5 8.8 13.4 12.5 18.8 10.3 | 7.0 15.6 16.0 Yield (bushels per acre), y 50.5 46.2 58.8 59.0 82.4 49.2 31.9 76.0 78.8 A) y = -4.379x + 4.267 B) y = 4.267x + 4.379 C) y = 4.379x + 4.267 D) y = 4.267x - 4.379