Answered step by step
Verified Expert Solution
Question
1 Approved Answer
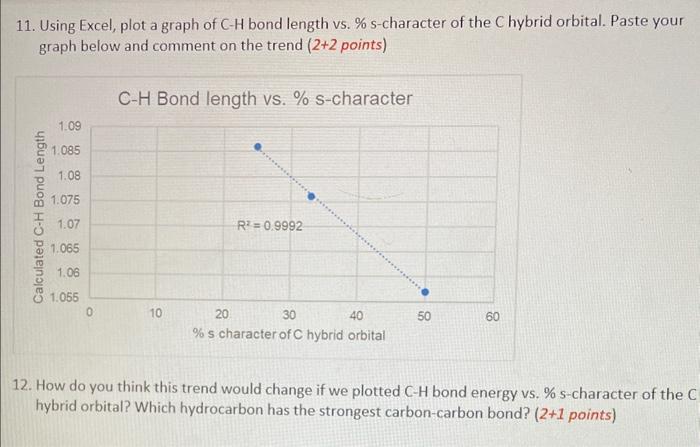
help explaining #12 please. 11. Using Excel, plot a graph of CH bond length vs. % s-character of the C hybrid orbital. Paste your graph
help explaining #12 please. 
11. Using Excel, plot a graph of CH bond length vs. % s-character of the C hybrid orbital. Paste your graph below and comment on the trend (2+2 points) 12. How do you think this trend would change if we plotted CH bond energy vs. % s-character of the C hybrid orbital? Which hydrocarbon has the strongest carbon-carbon bond? (2+1 points) 
Step by Step Solution
There are 3 Steps involved in it
Step: 1

Get Instant Access to Expert-Tailored Solutions
See step-by-step solutions with expert insights and AI powered tools for academic success
Step: 2

Step: 3

Ace Your Homework with AI
Get the answers you need in no time with our AI-driven, step-by-step assistance
Get Started


