

Answered step by step
Verified Expert Solution
Question
1 Approved Answer
help fast please 3-4 1-2 0 Soction 1: Mean, median and mode are all Mean median and mode are At least one measure of Very
help fast please 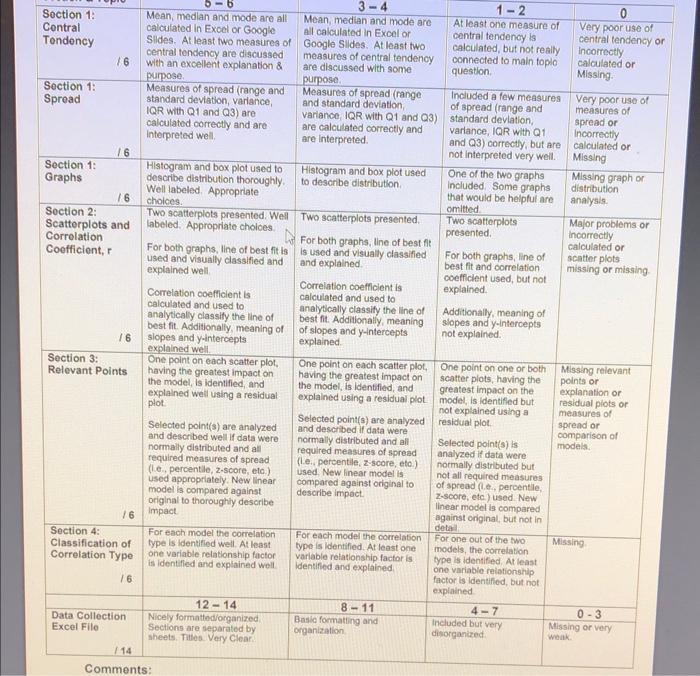
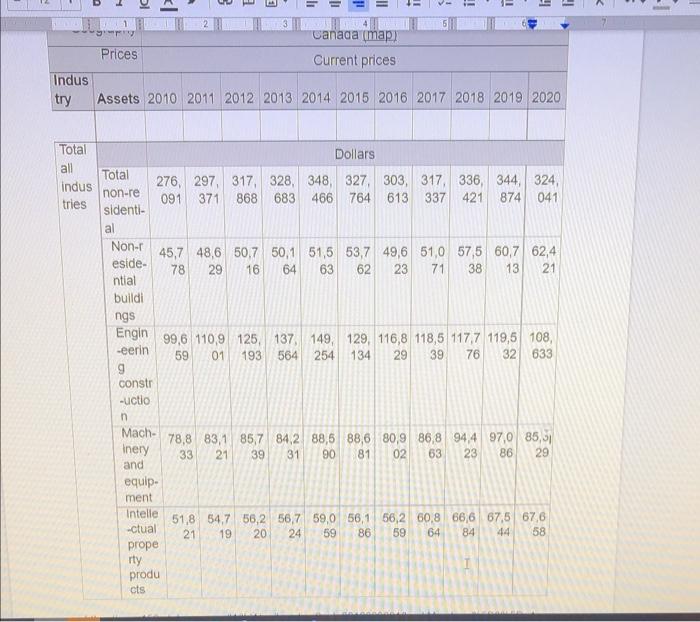
3-4 1-2 0 Soction 1: Mean, median and mode are all Mean median and mode are At least one measure of Very poor use of Contral calculated in Excel or Google All calculated in Excel or central tendency is central tendency or Tendency Sildes. At least two measures of Google Slides. At least two calculated, but not really Incorrectly central tendency are discussed measures of central tendency connected to main toplo calculated or 16 with an excellent explanation & are discussed with some question Missing purpose purpose Section 1: Measures of spread (range and Measures of spread (range Included a few measures Very poor use of Spread standard deviation, variance and standard deviation of spread (range and measures of IQR with Q1 and Q3) are variance IQR with Q1 and 3) Standard deviation, spread or calculated correctly and are are calculated correctly and variance, IQR with Q1 Incorrectly Interpreted well are interpreted and (3) correctly, but are calculated or 16 not interpreted very well. Missing Section 1: Histogram and box plot used to Histogram and box plot used One of the two graphs Missing graph or Graphs describe distribution thoroughly to describe distribution Included. Some graphs distribution Well labeled Appropriate that would be helpful are analysis 16 choices omitted Section 2: Two scatterplots presented. Well Two scatterplots presented Two scatterplots Major problems or Scatterplots and labeled. Appropriate choles. presented Incorrectly Correlation For both graphs, line of best fit calculated or Coefficient, For both graphs, line of best fit is is used and visually classified For both graphs, line of scatter plots used and visually classified and and explained best fit and correlation missing or missing explained well coefficient used, but not Correlation coefficient is explained Correlation coefficient is calculated and used to calculated and used to analytically classify the line of Additionally, meaning of analytically classify the line of best fit. Additionally, meaning slopes and y-intercepts best fit. Additionally, meaning of of slopes and y-intercepts not explained. 16 slopes and y-intercepts explained explained well Section 3: One point on each scatter plot, One point on each scatter plot, One point on one or both Missing relevant Relevant Points having the greatest impact on having the greatest impact on scatter plots, having the points or the model is identified, and the model is identified, and greatest impact on the explanation or explained well using a residual explained using a residual plot model is identified but residual plots or plot not explained using a measures of Selected points) are analyzed residual plot spread or Selected point(s) are analyzed and described If data were comparison of and described well if data were normally distributed and all Selected points) is modela normally distributed and all required measures of spread analyzed if data were required measures of spread (le percentile, Z-score, etc.) normally distributed but (le, percentile, 2-score, eto) used. New linear model is not all required measures used appropriately. New linear compared against original to of spread (e. percentile, model is compared against describe Impact Z-score, etc) used. New original to thoroughly describe linear model is compared /6 Impact against original, but not in detail Section 4 For each model the correlation For each model the correlation For one out of the two Missing Classification of type is identified well. At least type is identified. At least one models, the correlation Correlation Type one variable relationship factor variable relationship factor is type is identified. At least is identified and explained well Identified and explained one variable relationship factor is Identified, but not 16 explained 12-14 8 - 11 4-7 0 - 3 Data Collection Nicely formatted/organized Basio formatting and included but very Missing or very Excel File Sections are separated by organization disorganized wok sheets. TiesVery Clear 14 Comments: (50%) Section 1 One variable measures with graphs and distributions: Describe each of the 3 of your variables (two independent and one dependent) by calculating and making reference to the measures of Contrat tendency spread, and creating a histogram and box plots. Describe the distribution of your data as well. For each of the variables, describe the meaning of each of the measures as you state what they are. Section 2 Two variable measures with linear models and correlations: Create 2 scatterplots, one for each of your independent variables. Create the linear model to describe the relationship. Describe the strength of the correlation and the meaning of the slopes and y-intercepts. Section 3 Identify and remove relevant points: Identify one point on each scatter plot that has the greatest impact on the model by using residual plots. Describe the percentile that the point would be if the data was normally distributed, by using the mean, standard deviation and 2-Score Describe the impact of the point by comparing the new linear model to the original. Section 4 Classification of correlation type: For each of the models, classify the correlation type as cause and effect, reverse cause and effect, accidental or common cause. Explain your choice and brainstorm possible common cause factors where applicable Please use this rubric to review what is required to be submitted Final Culminating Project Rubric JU E E . A if 41 B TE = > 4 Canada (map) Prices Current prices Indus try Assets 2010 2011 2012 2013 2014 2015 2016 2017 2018 2019 2020 64 29 Total Dollars all Total indus 276, 297, 317, 328 348 327 303, 317 336 344, 324 non-re tries 091 371 868 683 466 764 613 337 421 874 041 sidenti- al Non-r 45,7 48,6 50,7 50, 51,5 53,7 49,6 51,0 57,5 60,7 62,4 eside- 78 29 16 63 62 23 71 38 13 21 ntial buildi ngs Engin 99,6 10,9 126, 137, 149, 129, 116,8 118,5 1177 119,5 108, -eerin 59 01 193 564 254 134 39 76 32 633 9 constr -uctio n Mach- 78,8 83,185,7 84,2 88,6 88,6 80,9 86,8 94,4 97,0 85, Inery 33 21 39 31 90 81 02 63 23 86 29 and equip ment Intelle 51,8 54.7 56,2 56,7 59,0 56,1 56,2 60,8 66,6 67,5 67,6 -ctual 21 19 20 24 59 86 59 64 84 44 58 prope rty produ cts odio 3-4 1-2 0 Soction 1: Mean, median and mode are all Mean median and mode are At least one measure of Very poor use of Contral calculated in Excel or Google All calculated in Excel or central tendency is central tendency or Tendency Sildes. At least two measures of Google Slides. At least two calculated, but not really Incorrectly central tendency are discussed measures of central tendency connected to main toplo calculated or 16 with an excellent explanation & are discussed with some question Missing purpose purpose Section 1: Measures of spread (range and Measures of spread (range Included a few measures Very poor use of Spread standard deviation, variance and standard deviation of spread (range and measures of IQR with Q1 and Q3) are variance IQR with Q1 and 3) Standard deviation, spread or calculated correctly and are are calculated correctly and variance, IQR with Q1 Incorrectly Interpreted well are interpreted and (3) correctly, but are calculated or 16 not interpreted very well. Missing Section 1: Histogram and box plot used to Histogram and box plot used One of the two graphs Missing graph or Graphs describe distribution thoroughly to describe distribution Included. Some graphs distribution Well labeled Appropriate that would be helpful are analysis 16 choices omitted Section 2: Two scatterplots presented. Well Two scatterplots presented Two scatterplots Major problems or Scatterplots and labeled. Appropriate choles. presented Incorrectly Correlation For both graphs, line of best fit calculated or Coefficient, For both graphs, line of best fit is is used and visually classified For both graphs, line of scatter plots used and visually classified and and explained best fit and correlation missing or missing explained well coefficient used, but not Correlation coefficient is explained Correlation coefficient is calculated and used to calculated and used to analytically classify the line of Additionally, meaning of analytically classify the line of best fit. Additionally, meaning slopes and y-intercepts best fit. Additionally, meaning of of slopes and y-intercepts not explained. 16 slopes and y-intercepts explained explained well Section 3: One point on each scatter plot, One point on each scatter plot, One point on one or both Missing relevant Relevant Points having the greatest impact on having the greatest impact on scatter plots, having the points or the model is identified, and the model is identified, and greatest impact on the explanation or explained well using a residual explained using a residual plot model is identified but residual plots or plot not explained using a measures of Selected points) are analyzed residual plot spread or Selected point(s) are analyzed and described If data were comparison of and described well if data were normally distributed and all Selected points) is modela normally distributed and all required measures of spread analyzed if data were required measures of spread (le percentile, Z-score, etc.) normally distributed but (le, percentile, 2-score, eto) used. New linear model is not all required measures used appropriately. New linear compared against original to of spread (e. percentile, model is compared against describe Impact Z-score, etc) used. New original to thoroughly describe linear model is compared /6 Impact against original, but not in detail Section 4 For each model the correlation For each model the correlation For one out of the two Missing Classification of type is identified well. At least type is identified. At least one models, the correlation Correlation Type one variable relationship factor variable relationship factor is type is identified. At least is identified and explained well Identified and explained one variable relationship factor is Identified, but not 16 explained 12-14 8 - 11 4-7 0 - 3 Data Collection Nicely formatted/organized Basio formatting and included but very Missing or very Excel File Sections are separated by organization disorganized wok sheets. TiesVery Clear 14 Comments: (50%) Section 1 One variable measures with graphs and distributions: Describe each of the 3 of your variables (two independent and one dependent) by calculating and making reference to the measures of Contrat tendency spread, and creating a histogram and box plots. Describe the distribution of your data as well. For each of the variables, describe the meaning of each of the measures as you state what they are. Section 2 Two variable measures with linear models and correlations: Create 2 scatterplots, one for each of your independent variables. Create the linear model to describe the relationship. Describe the strength of the correlation and the meaning of the slopes and y-intercepts. Section 3 Identify and remove relevant points: Identify one point on each scatter plot that has the greatest impact on the model by using residual plots. Describe the percentile that the point would be if the data was normally distributed, by using the mean, standard deviation and 2-Score Describe the impact of the point by comparing the new linear model to the original. Section 4 Classification of correlation type: For each of the models, classify the correlation type as cause and effect, reverse cause and effect, accidental or common cause. Explain your choice and brainstorm possible common cause factors where applicable Please use this rubric to review what is required to be submitted Final Culminating Project Rubric JU E E . A if 41 B TE = > 4 Canada (map) Prices Current prices Indus try Assets 2010 2011 2012 2013 2014 2015 2016 2017 2018 2019 2020 64 29 Total Dollars all Total indus 276, 297, 317, 328 348 327 303, 317 336 344, 324 non-re tries 091 371 868 683 466 764 613 337 421 874 041 sidenti- al Non-r 45,7 48,6 50,7 50, 51,5 53,7 49,6 51,0 57,5 60,7 62,4 eside- 78 29 16 63 62 23 71 38 13 21 ntial buildi ngs Engin 99,6 10,9 126, 137, 149, 129, 116,8 118,5 1177 119,5 108, -eerin 59 01 193 564 254 134 39 76 32 633 9 constr -uctio n Mach- 78,8 83,185,7 84,2 88,6 88,6 80,9 86,8 94,4 97,0 85, Inery 33 21 39 31 90 81 02 63 23 86 29 and equip ment Intelle 51,8 54.7 56,2 56,7 59,0 56,1 56,2 60,8 66,6 67,5 67,6 -ctual 21 19 20 24 59 86 59 64 84 44 58 prope rty produ cts odio Step by Step Solution
There are 3 Steps involved in it
Step: 1

Get Instant Access to Expert-Tailored Solutions
See step-by-step solutions with expert insights and AI powered tools for academic success
Step: 2

Step: 3
Ace Your Homework with AI
Get the answers you need in no time with our AI-driven, step-by-step assistance
Get Started
Advances In Database Technology Edbt 88 International Conference On Extending Database Technology Venice Italy March 14 18 1988 Proceedings Lncs 303
Authors: Joachim W. Schmidt ,Stefano Ceri ,Michele Missikoff
1988th Edition
3540190740, 978-3540190745