

Answered step by step
Verified Expert Solution
Question
1 Approved Answer
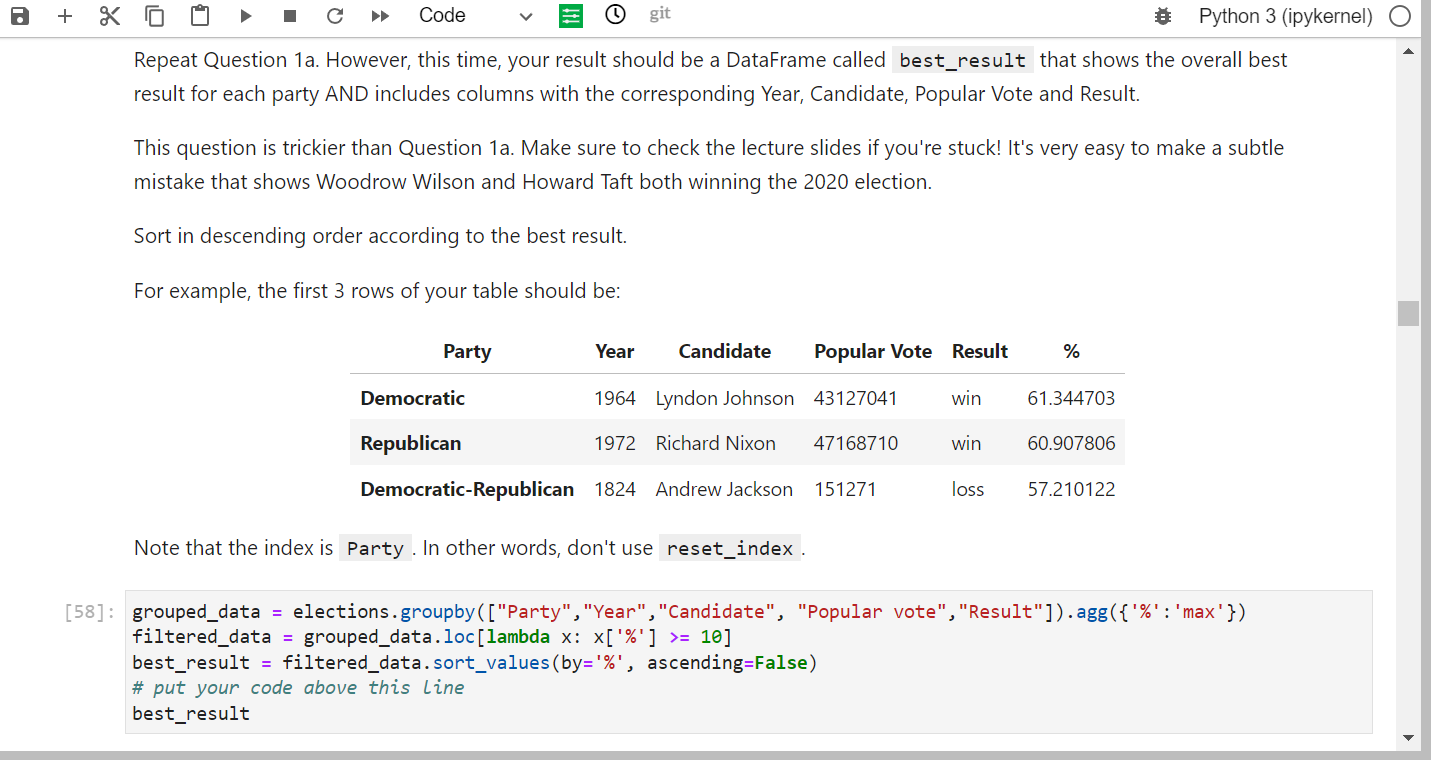
Help filtering overall best result for each party in dataframe Repeat Question 1 a . However, this time, your result should be a DataFrame called
Help filtering overall best result for each party in dataframe Repeat Question a However, this time, your result should be a DataFrame called bestresult that shows the overall best
result for each party AND includes columns with the corresponding Year, Candidate, Popular Vote and Result.
This question is trickier than Question a Make sure to check the lecture slides if you're stuck! It's very easy to make a subtle
mistake that shows Woodrow Wilson and Howard Taft both winning the election.
Sort in descending order according to the best result.
For example, the first rows of your table should be:
Note that the index is Party. In other words, don't use
groupeddata elections.groupbyParty "Year", "Candidate", "Popular vote", "Result"agg: 'max'
filtereddata groupeddata.loclambda x: x
bestresult filtereddata.sortvalues by ascendingFalse
# put your code above this line
bestresult
Step by Step Solution
There are 3 Steps involved in it
Step: 1

Get Instant Access to Expert-Tailored Solutions
See step-by-step solutions with expert insights and AI powered tools for academic success
Step: 2

Step: 3
Ace Your Homework with AI
Get the answers you need in no time with our AI-driven, step-by-step assistance
Get Started
DATABASE Administrator Make A Difference
Authors: Mohciine Elmourabit
1st Edition
B0CGM7XG75, 978-1722657802