

Answered step by step
Verified Expert Solution
Question
1 Approved Answer
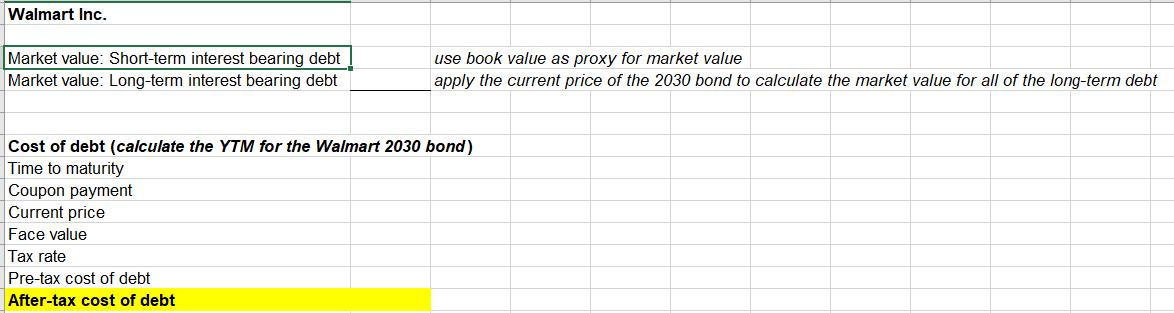
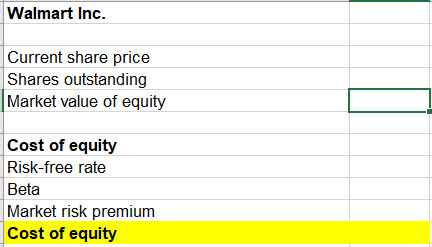
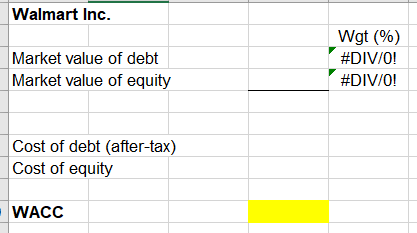
help find walmart's after-tax debt, cost of equity, and weighted average cost of capital. Thank you so much! OVERVIEW In March 2019, Dale and Lee,
help find walmart's after-tax debt, cost of equity, and weighted average cost of capital. Thank you so much!
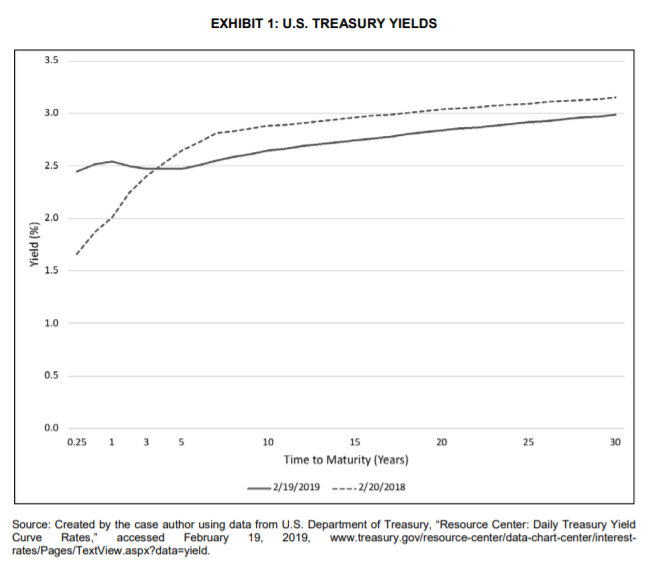
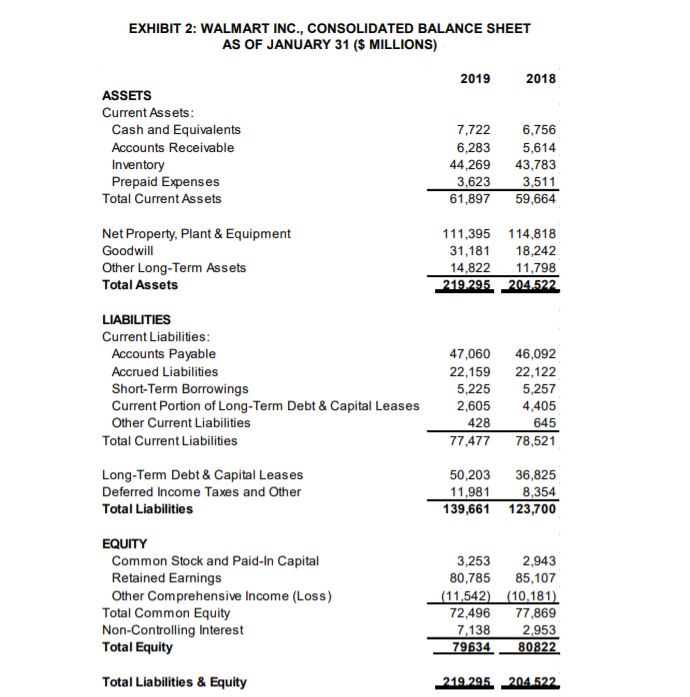
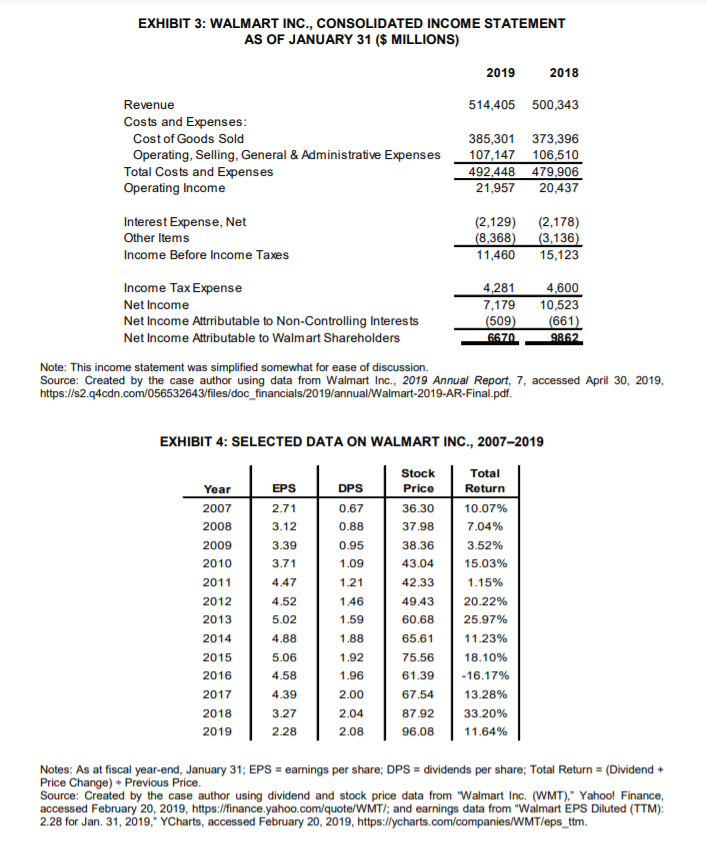
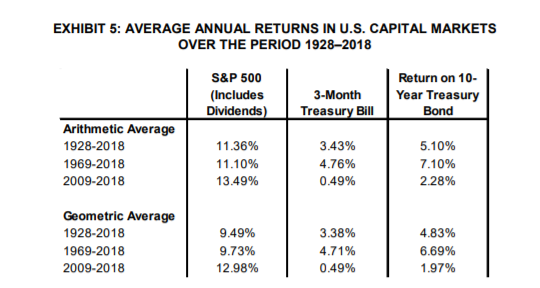
OVERVIEW In March 2019, Dale and Lee, senior managers from technology firms, were attending an executive education program-Financial Management for Non-Financial Executives at a highly-regarded business school. They were provided with background readings related to estimating a firm's cost of capital. Their small-group learning team was assigned the task of applying the learnings from the readings and gathering background information related to Walmart Inc. (Walmart) in order to estimate its costs of capital (see Exhibits 1 to 5). The following day, they would participate in a class discussion, share their results, and discuss why the cost of capital was such an important concept. Walmart had humble beginnings: Sam Walton opened the first Walmart store in 1962 in Rogers, Arkansas.? Subsequently, Walmart grew to be the world's largest retail store, serving 275 million customers weekly from more than 11,300 stores and numerous e-commerce websites under 58 banners in 27 countries. Walmart's goal was to help people around the world save money and live better, and its strategy was to make every day easier for busy families, operate with discipline, sharpen its culture and become digital, and make trust a competitive advantage. In the fiscal year ending January 31, 2019, Walmart had invested over $10 billion in capital expenditures: over $300 million on new stores in the United States; over $2 billion on remodelling; over $5 billion on e-commerce, technology, and supply chain; and $2.7 billion internationally." ESTIMATING THE COST OF CAPITAL Dale and Lee sat down with the information that had been gathered and discussed the task-how they would estimate the cost of capital, and why it was important. Dale: I think the reason we really care about the cost of capital is because we want to know what hurdle rate Walmart should use for its annual investments in capital projects, which represent billions of dollars each year. Lee: But I'm not sure if it should make any difference to senior management whether the company is investing in more U.S. stores, remodelling, or investing internationally. Shouldn't they want the same return? Dale: Interesting question. So, where should we start? I was thinking we might look at the balance sheet-particularly the liabilities and equity section. Shouldn't that show how Walmart financed its assets, which cost over $200 billion? Lee: Yes, and I think we should try to associate a cost with each of the items. Then we need to figure out how to average them in order to estimate the cost of capital. Dale: I think we need some kind of interest rate, or borrowing rate, for each of the debt components. Or maybe we can just take a look at how much interest the company paid last year relative to its debt? That might be easier. Lee: There sure are a lot of interest rates. I noticed on the U.S. Department of Treasury website that three-month treasury bills were yielding 2.45 per cent, while one-, five-, and 10-year treasury bonds were yielding 2.54 per cent, 2.47 per cent, and 2.65 per cent, respectively.' I pulled together those and some other rates to graph today's yield curve compared with last year's (see Exhibit 1). I wonder if we can somehow use this information. Dale: I found some other interest rates as well. The prime rate is 5.50 per cent, and three-month commercial paper was averaging 2.73 per cent. I read in the annual report that Walmart has issued commercial paper in the past as part of its short-term borrowings so perhaps that information might be relevant. I also read that Walmart uses short-term borrowing to provide funds for operations, make capital expenditures, and cover other cash requirements. Lee: Yes, and I read in the same report that Walmart has issued lots of bonds. Other reports showed the same pattern. For example, I noticed that on February 15, 2000, Walmart issued $1 billion in bonds with a coupon rate of 7.55 per cent. The bonds mature on February 15, 2030, around 11 years from now. I also noticed from an online source that these bonds were selling for $136.38 and yielding 3.53 per cent. I think I need to re-read the background material we were provided with because I'm confused about the difference between coupon rates and yields. Which is more relevant for us? Dale: What about preferred shares? I don't think Walmart has any currently, but I read that years ago it issued some kind of securities that were like preferred shares. I don't think the company has any plans to issue new preferred shares in the next little while, but maybe we should be prepared to figure out how it would affect the cost of capital if it did. Lee: How should we go about estimating the cost of equity? Dale: I think, since shareholder return is in the form of dividends that shareholders receive, we could examine the annual dividends relative to the current stock price. Over the past year, shareholders received $2.08 per share in dividends. The stock was recently trading for $102.20. Lee: I think earnings are more relevant than dividends. Earnings were down recently because of several one-time write-offs, at the end of the last fiscal year. Walmart recorded $2.26 in unadjusted earnings per share, but $4.91 in adjusted earnings per share. So why not take the earnings yield relative to the stock price? Dale: I wonder if we can estimate an equity return using accounting information such as the book value of equity. I estimated Walmart's return on equity or ROE to be 8.9 per cent as of the fiscal year ending January 31, 2019. For 2018, 2017, and 2016, it was 12.7, 17.2, and 18.1 per cent, respectively. Lee: But that includes retained earnings. Aren't those like free capital and therefore something we can ignore? Dale: Maybe we're overlooking something; there may be a different approach. Recall that we read about the beta of a stock. It is usually estimated by regressing the return on a stock, like Walmart, against the return on the market, like the S&P 500. According to the Bloomberg terminal we accessed in our library, Walmart's recent "raw" beta was 0.56. It was based on a regression of two years of weekly data. Lee: I noticed that as well. There was also an adjusted beta of 0.71. According to Bloomberg, the ad hoc adjustment 0.67 times the raw beta plus 0.33always makes the adjusted beta closer to the market's beta of 1.0. They do this because of the assumption that a security's beta tends to move toward the market average over time. Dale: Well, I think if we try to incorporate Walmart's beta, then we need to somehow take into account overall market returns. Lee: We also need to incorporate taxes. I'm not sure how we go about doing that. But I also noticed in the business news that corporate tax rates are now lower than in the recent past due to some new U.S. tax regulations. I read that the new rate is 21 per cent. But a recent press release to accompany Walmart's quarterly returns says the company is anticipating an effective tax rate of around 27 per cent Dale: What about deferred income taxes? I remember reading that these can arise when a company is allowed to depreciate its assets at a faster rate, for tax purposes, than the actual economic depreciation. Is that money that needs to be paid back to the tax department? If so, what cost is associated with it? Lee: I'm not sure. I also noticed there are other items on the balance sheet under Liabilities and Equity," and I'm not even sure what they mean. Dale: I may have figured them out: "Other Non-Current Liabilities which is lumped in with Deferred Income Taxes and is probably about half that total-may have to do with some unrealized losses on hedging instruments. "Other Comprehensive Loss was related to foreign exchange losses, with the U.S. dollar stronger relative to other currencies. And "Non-Controlling Interest adjusts for subsidiaries that Walmart has a majority stake in. I think we can ignore all of those items Lee: It's getting late, and we haven't even talked about how we would estimate the weights for the various sources of capital. I'm wondering if we should just look at the balance sheet for clues. Or maybe there's another way. Dale: I'm not sure if it even makes sense to take an average. Shouldn't we just look at the next source of financing? For example, if Walmart borrows or issues bonds just before taking on its next major project, then shouldn't we just take the cost associated with that? Lee: Well, I think we've now come full circle. Once we estimate the cost of capital, how do we determine what hurdle rate we should use for projects? And how should Walmart decide which projects to accept: using the net present value approach or the internal rate of return method? Dale: I don't think it matters. But I do think we need to try to put this all together soon so that we get a final number and explain how we arrived at it! EXHIBIT 1: U.S. TREASURY YIELDS 3.5 3.0 2.5 2.0 Yield (%) 1.5 1.0 0.5 0.0 0.25 1 3 5 10 15 20 25 30 Time to Maturity (Years) -2/19/2019 ----2/20/2018 Source: Created by the case author using data from U.S. Department of Treasury, "Resource Center: Daily Treasury Yield Curve Rates, accessed February 19, 2019, www.treasury.gov/resource-center/data-chart-center/interest- rates/Pages/TextView.aspx?data=yield. EXHIBIT 2: WALMART INC., CONSOLIDATED BALANCE SHEET AS OF JANUARY 31 ($ MILLIONS) 2019 2018 ASSETS Current Assets: Cash and Equivalents Accounts Receivable Inventory Prepaid Expenses Total Current Assets 7,722 6,283 44,269 3,623 61,897 6,756 5,614 43,783 3,511 59,664 Net Property, Plant & Equipment Goodwill Other Long-Term Assets Total Assets 111,395 114,818 31,181 18,242 14,822 11,798 219.295 204.522 LIABILITIES Current Liabilities: Accounts Payable Accrued Liabilities Short-Term Borrowings Current Portion of Long-Term Debt & Capital Leases Other Current Liabilities Total Current Liabilities 47,060 22,159 5,225 2,605 428 77,477 46,092 22,122 5,257 4,405 645 78,521 Long-Term Debt & Capital Leases Deferred Income Taxes and Other Total Liabilities 50,203 36,825 11,981 8,354 139,661 123,700 EQUITY Common Stock and Paid-In Capital Retained Earnings Other Comprehensive Income (Loss) Total Common Equity Non-Controlling Interest Total Equity 3,253 2,943 80,785 85,107 (11,542) (10,181) 72,496 77,869 7,138 2,953 79634 80822 Total Liabilities & Equity 219.295 204.522 EXHIBIT 3: WALMART INC., CONSOLIDATED INCOME STATEMENT AS OF JANUARY 31 ($ MILLIONS) 2019 2018 Revenue 514,405 500,343 Costs and Expenses: Cost of Goods Sold 385,301 373,396 Operating, Selling, General & Administrative Expenses 107,147 106,510 Total Costs and Expenses 492,448 479,906 Operating Income 21,957 20,437 Interest Expense, Net Other Items Income Before Income Taxes (2,129) (8,368) 11,460 (2,178) (3,136) 15,123 Income Tax Expense 4,281 4,600 Net Income 7,179 10,523 Net Income Attrributable to Non-Controlling Interests (509) (661). Net Income Attributable to Walmart Shareholders 6670 9862 Note: This income statement was simplified somewhat for ease of discussion. Source: Created by the case author using data from Walmart Inc., 2019 Annual Report, 7, accessed April 30, 2019, https://s2.94cdn.com/056532643/files/doc_financials/2019/annual/Walmart-2019-AR-Final.pdf EXHIBIT 4: SELECTED DATA ON WALMART INC., 2007-2019 3 EPS 2.71 3.12 3.39 DPS 0.67 Stock Price 36.30 37.98 Total Return 10.07% 0.88 0.95 7.04% 3.52% 15.03% 1.15% 1.09 38.36 43.04 42.33 3.71 4.47 1.21 1.46 Year 2007 2008 2009 2010 2011 2012 2013 2014 2015 2016 2017 2018 2019 4.52 5.02 49.43 60.68 1.59 20.22% 25.97% 11.23% 4.88 1.88 65.61 1.92 1.96 75.56 61.39 5.06 4.58 4.39 3.27 2.28 18.10% -16.17% 13.28% 2.00 2.04 2.08 67.54 87.92 96.08 33.20% 11.64% Notes: As at fiscal year-end, January 31; EPS = earnings per share; DPS = dividends per share; Total Return = (Dividend + Price Change) + Previous Price. Source: Created by the case author using dividend and stock price data from Walmart Inc. (WMT)." Yahoo! Finance, accessed February 20, 2019, https://finance.yahoo.com/quote/WMT); and earnings data from "Walmart EPS Diluted (TTM): 2.28 for Jan. 31, 2019," YCharts, accessed February 20, 2019, https://ycharts.com/companies/WMT/eps_ttm. EXHIBIT 5: AVERAGE ANNUAL RETURNS IN U.S. CAPITAL MARKETS OVER THE PERIOD 1928-2018 S&P 500 (Includes Dividends) 3-Month Treasury Bill Return on 10- Year Treasury Bond Arithmetic Average 1928-2018 1969-2018 2009-2018 11.36% 11.10% 13.49% 3.43% 4.76% 0.49% 5.10% 7.10% 2.28% Geometric Average 1928-2018 1969-2018 2009-2018 9.49% 9.73% 12.98% 3.38% 4.71% 0.49% 4.83% 6.69% 1.97% Walmart Inc. Market value: Short-term interest bearing debt Market value: Long-term interest bearing debt use book value as proxy for market value apply the current price of the 2030 bond to calculate the market value for all of the long-term debt Cost of debt (calculate the YTM for the Walmart 2030 bond) Time to maturity Coupon payment Current price Face value Tax rate Pre-tax cost of debt After-tax cost of debt Walmart Inc. Current share price Shares outstanding Market value of equity Cost of equity Risk-free rate Beta Market risk premium Cost of equity Walmart Inc. Market value of debt Market value of equity Wgt (%) #DIV/0! #DIV/0! Cost of debt (after-tax) Cost of equity WACC OVERVIEW In March 2019, Dale and Lee, senior managers from technology firms, were attending an executive education program-Financial Management for Non-Financial Executives at a highly-regarded business school. They were provided with background readings related to estimating a firm's cost of capital. Their small-group learning team was assigned the task of applying the learnings from the readings and gathering background information related to Walmart Inc. (Walmart) in order to estimate its costs of capital (see Exhibits 1 to 5). The following day, they would participate in a class discussion, share their results, and discuss why the cost of capital was such an important concept. Walmart had humble beginnings: Sam Walton opened the first Walmart store in 1962 in Rogers, Arkansas.? Subsequently, Walmart grew to be the world's largest retail store, serving 275 million customers weekly from more than 11,300 stores and numerous e-commerce websites under 58 banners in 27 countries. Walmart's goal was to help people around the world save money and live better, and its strategy was to make every day easier for busy families, operate with discipline, sharpen its culture and become digital, and make trust a competitive advantage. In the fiscal year ending January 31, 2019, Walmart had invested over $10 billion in capital expenditures: over $300 million on new stores in the United States; over $2 billion on remodelling; over $5 billion on e-commerce, technology, and supply chain; and $2.7 billion internationally." ESTIMATING THE COST OF CAPITAL Dale and Lee sat down with the information that had been gathered and discussed the task-how they would estimate the cost of capital, and why it was important. Dale: I think the reason we really care about the cost of capital is because we want to know what hurdle rate Walmart should use for its annual investments in capital projects, which represent billions of dollars each year. Lee: But I'm not sure if it should make any difference to senior management whether the company is investing in more U.S. stores, remodelling, or investing internationally. Shouldn't they want the same return? Dale: Interesting question. So, where should we start? I was thinking we might look at the balance sheet-particularly the liabilities and equity section. Shouldn't that show how Walmart financed its assets, which cost over $200 billion? Lee: Yes, and I think we should try to associate a cost with each of the items. Then we need to figure out how to average them in order to estimate the cost of capital. Dale: I think we need some kind of interest rate, or borrowing rate, for each of the debt components. Or maybe we can just take a look at how much interest the company paid last year relative to its debt? That might be easier. Lee: There sure are a lot of interest rates. I noticed on the U.S. Department of Treasury website that three-month treasury bills were yielding 2.45 per cent, while one-, five-, and 10-year treasury bonds were yielding 2.54 per cent, 2.47 per cent, and 2.65 per cent, respectively.' I pulled together those and some other rates to graph today's yield curve compared with last year's (see Exhibit 1). I wonder if we can somehow use this information. Dale: I found some other interest rates as well. The prime rate is 5.50 per cent, and three-month commercial paper was averaging 2.73 per cent. I read in the annual report that Walmart has issued commercial paper in the past as part of its short-term borrowings so perhaps that information might be relevant. I also read that Walmart uses short-term borrowing to provide funds for operations, make capital expenditures, and cover other cash requirements. Lee: Yes, and I read in the same report that Walmart has issued lots of bonds. Other reports showed the same pattern. For example, I noticed that on February 15, 2000, Walmart issued $1 billion in bonds with a coupon rate of 7.55 per cent. The bonds mature on February 15, 2030, around 11 years from now. I also noticed from an online source that these bonds were selling for $136.38 and yielding 3.53 per cent. I think I need to re-read the background material we were provided with because I'm confused about the difference between coupon rates and yields. Which is more relevant for us? Dale: What about preferred shares? I don't think Walmart has any currently, but I read that years ago it issued some kind of securities that were like preferred shares. I don't think the company has any plans to issue new preferred shares in the next little while, but maybe we should be prepared to figure out how it would affect the cost of capital if it did. Lee: How should we go about estimating the cost of equity? Dale: I think, since shareholder return is in the form of dividends that shareholders receive, we could examine the annual dividends relative to the current stock price. Over the past year, shareholders received $2.08 per share in dividends. The stock was recently trading for $102.20. Lee: I think earnings are more relevant than dividends. Earnings were down recently because of several one-time write-offs, at the end of the last fiscal year. Walmart recorded $2.26 in unadjusted earnings per share, but $4.91 in adjusted earnings per share. So why not take the earnings yield relative to the stock price? Dale: I wonder if we can estimate an equity return using accounting information such as the book value of equity. I estimated Walmart's return on equity or ROE to be 8.9 per cent as of the fiscal year ending January 31, 2019. For 2018, 2017, and 2016, it was 12.7, 17.2, and 18.1 per cent, respectively. Lee: But that includes retained earnings. Aren't those like free capital and therefore something we can ignore? Dale: Maybe we're overlooking something; there may be a different approach. Recall that we read about the beta of a stock. It is usually estimated by regressing the return on a stock, like Walmart, against the return on the market, like the S&P 500. According to the Bloomberg terminal we accessed in our library, Walmart's recent "raw" beta was 0.56. It was based on a regression of two years of weekly data. Lee: I noticed that as well. There was also an adjusted beta of 0.71. According to Bloomberg, the ad hoc adjustment 0.67 times the raw beta plus 0.33always makes the adjusted beta closer to the market's beta of 1.0. They do this because of the assumption that a security's beta tends to move toward the market average over time. Dale: Well, I think if we try to incorporate Walmart's beta, then we need to somehow take into account overall market returns. Lee: We also need to incorporate taxes. I'm not sure how we go about doing that. But I also noticed in the business news that corporate tax rates are now lower than in the recent past due to some new U.S. tax regulations. I read that the new rate is 21 per cent. But a recent press release to accompany Walmart's quarterly returns says the company is anticipating an effective tax rate of around 27 per cent Dale: What about deferred income taxes? I remember reading that these can arise when a company is allowed to depreciate its assets at a faster rate, for tax purposes, than the actual economic depreciation. Is that money that needs to be paid back to the tax department? If so, what cost is associated with it? Lee: I'm not sure. I also noticed there are other items on the balance sheet under Liabilities and Equity," and I'm not even sure what they mean. Dale: I may have figured them out: "Other Non-Current Liabilities which is lumped in with Deferred Income Taxes and is probably about half that total-may have to do with some unrealized losses on hedging instruments. "Other Comprehensive Loss was related to foreign exchange losses, with the U.S. dollar stronger relative to other currencies. And "Non-Controlling Interest adjusts for subsidiaries that Walmart has a majority stake in. I think we can ignore all of those items Lee: It's getting late, and we haven't even talked about how we would estimate the weights for the various sources of capital. I'm wondering if we should just look at the balance sheet for clues. Or maybe there's another way. Dale: I'm not sure if it even makes sense to take an average. Shouldn't we just look at the next source of financing? For example, if Walmart borrows or issues bonds just before taking on its next major project, then shouldn't we just take the cost associated with that? Lee: Well, I think we've now come full circle. Once we estimate the cost of capital, how do we determine what hurdle rate we should use for projects? And how should Walmart decide which projects to accept: using the net present value approach or the internal rate of return method? Dale: I don't think it matters. But I do think we need to try to put this all together soon so that we get a final number and explain how we arrived at it! EXHIBIT 1: U.S. TREASURY YIELDS 3.5 3.0 2.5 2.0 Yield (%) 1.5 1.0 0.5 0.0 0.25 1 3 5 10 15 20 25 30 Time to Maturity (Years) -2/19/2019 ----2/20/2018 Source: Created by the case author using data from U.S. Department of Treasury, "Resource Center: Daily Treasury Yield Curve Rates, accessed February 19, 2019, www.treasury.gov/resource-center/data-chart-center/interest- rates/Pages/TextView.aspx?data=yield. EXHIBIT 2: WALMART INC., CONSOLIDATED BALANCE SHEET AS OF JANUARY 31 ($ MILLIONS) 2019 2018 ASSETS Current Assets: Cash and Equivalents Accounts Receivable Inventory Prepaid Expenses Total Current Assets 7,722 6,283 44,269 3,623 61,897 6,756 5,614 43,783 3,511 59,664 Net Property, Plant & Equipment Goodwill Other Long-Term Assets Total Assets 111,395 114,818 31,181 18,242 14,822 11,798 219.295 204.522 LIABILITIES Current Liabilities: Accounts Payable Accrued Liabilities Short-Term Borrowings Current Portion of Long-Term Debt & Capital Leases Other Current Liabilities Total Current Liabilities 47,060 22,159 5,225 2,605 428 77,477 46,092 22,122 5,257 4,405 645 78,521 Long-Term Debt & Capital Leases Deferred Income Taxes and Other Total Liabilities 50,203 36,825 11,981 8,354 139,661 123,700 EQUITY Common Stock and Paid-In Capital Retained Earnings Other Comprehensive Income (Loss) Total Common Equity Non-Controlling Interest Total Equity 3,253 2,943 80,785 85,107 (11,542) (10,181) 72,496 77,869 7,138 2,953 79634 80822 Total Liabilities & Equity 219.295 204.522 EXHIBIT 3: WALMART INC., CONSOLIDATED INCOME STATEMENT AS OF JANUARY 31 ($ MILLIONS) 2019 2018 Revenue 514,405 500,343 Costs and Expenses: Cost of Goods Sold 385,301 373,396 Operating, Selling, General & Administrative Expenses 107,147 106,510 Total Costs and Expenses 492,448 479,906 Operating Income 21,957 20,437 Interest Expense, Net Other Items Income Before Income Taxes (2,129) (8,368) 11,460 (2,178) (3,136) 15,123 Income Tax Expense 4,281 4,600 Net Income 7,179 10,523 Net Income Attrributable to Non-Controlling Interests (509) (661). Net Income Attributable to Walmart Shareholders 6670 9862 Note: This income statement was simplified somewhat for ease of discussion. Source: Created by the case author using data from Walmart Inc., 2019 Annual Report, 7, accessed April 30, 2019, https://s2.94cdn.com/056532643/files/doc_financials/2019/annual/Walmart-2019-AR-Final.pdf EXHIBIT 4: SELECTED DATA ON WALMART INC., 2007-2019 3 EPS 2.71 3.12 3.39 DPS 0.67 Stock Price 36.30 37.98 Total Return 10.07% 0.88 0.95 7.04% 3.52% 15.03% 1.15% 1.09 38.36 43.04 42.33 3.71 4.47 1.21 1.46 Year 2007 2008 2009 2010 2011 2012 2013 2014 2015 2016 2017 2018 2019 4.52 5.02 49.43 60.68 1.59 20.22% 25.97% 11.23% 4.88 1.88 65.61 1.92 1.96 75.56 61.39 5.06 4.58 4.39 3.27 2.28 18.10% -16.17% 13.28% 2.00 2.04 2.08 67.54 87.92 96.08 33.20% 11.64% Notes: As at fiscal year-end, January 31; EPS = earnings per share; DPS = dividends per share; Total Return = (Dividend + Price Change) + Previous Price. Source: Created by the case author using dividend and stock price data from Walmart Inc. (WMT)." Yahoo! Finance, accessed February 20, 2019, https://finance.yahoo.com/quote/WMT); and earnings data from "Walmart EPS Diluted (TTM): 2.28 for Jan. 31, 2019," YCharts, accessed February 20, 2019, https://ycharts.com/companies/WMT/eps_ttm. EXHIBIT 5: AVERAGE ANNUAL RETURNS IN U.S. CAPITAL MARKETS OVER THE PERIOD 1928-2018 S&P 500 (Includes Dividends) 3-Month Treasury Bill Return on 10- Year Treasury Bond Arithmetic Average 1928-2018 1969-2018 2009-2018 11.36% 11.10% 13.49% 3.43% 4.76% 0.49% 5.10% 7.10% 2.28% Geometric Average 1928-2018 1969-2018 2009-2018 9.49% 9.73% 12.98% 3.38% 4.71% 0.49% 4.83% 6.69% 1.97% Walmart Inc. Market value: Short-term interest bearing debt Market value: Long-term interest bearing debt use book value as proxy for market value apply the current price of the 2030 bond to calculate the market value for all of the long-term debt Cost of debt (calculate the YTM for the Walmart 2030 bond) Time to maturity Coupon payment Current price Face value Tax rate Pre-tax cost of debt After-tax cost of debt Walmart Inc. Current share price Shares outstanding Market value of equity Cost of equity Risk-free rate Beta Market risk premium Cost of equity Walmart Inc. Market value of debt Market value of equity Wgt (%) #DIV/0! #DIV/0! Cost of debt (after-tax) Cost of equity WACCStep by Step Solution
There are 3 Steps involved in it
Step: 1

Get Instant Access to Expert-Tailored Solutions
See step-by-step solutions with expert insights and AI powered tools for academic success
Step: 2

Step: 3
Ace Your Homework with AI
Get the answers you need in no time with our AI-driven, step-by-step assistance
Get Started
Risk Management For Forex Trading Beginners Tips For Managing Risk In Forex Trading For Beginners
Authors: J.r. Bosanko
1st Edition
1542317657, 978-1542317658