Answered step by step
Verified Expert Solution
Question
1 Approved Answer
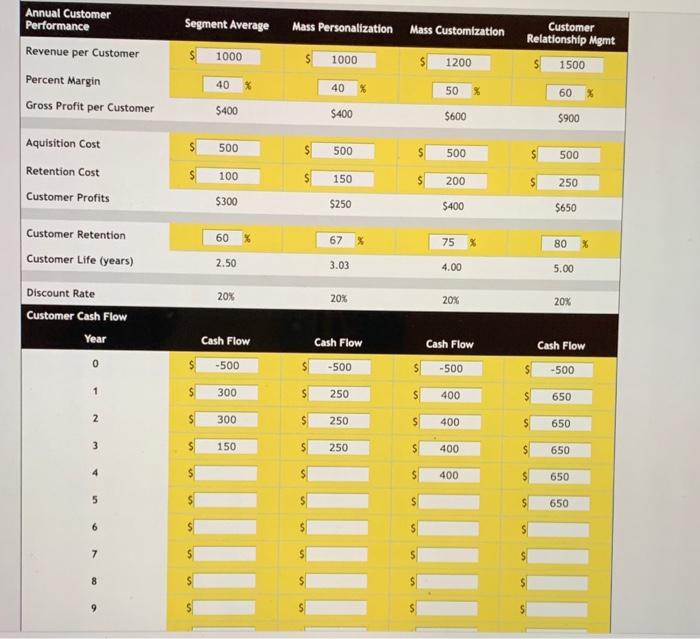
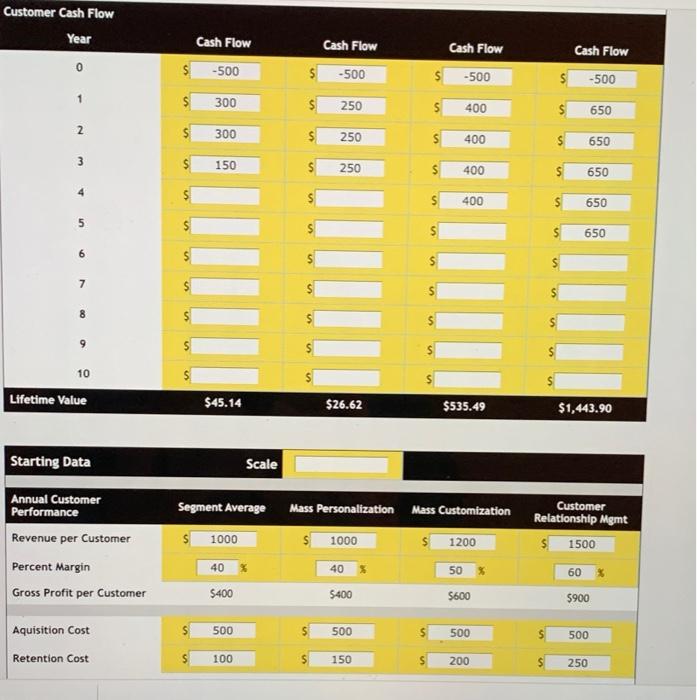
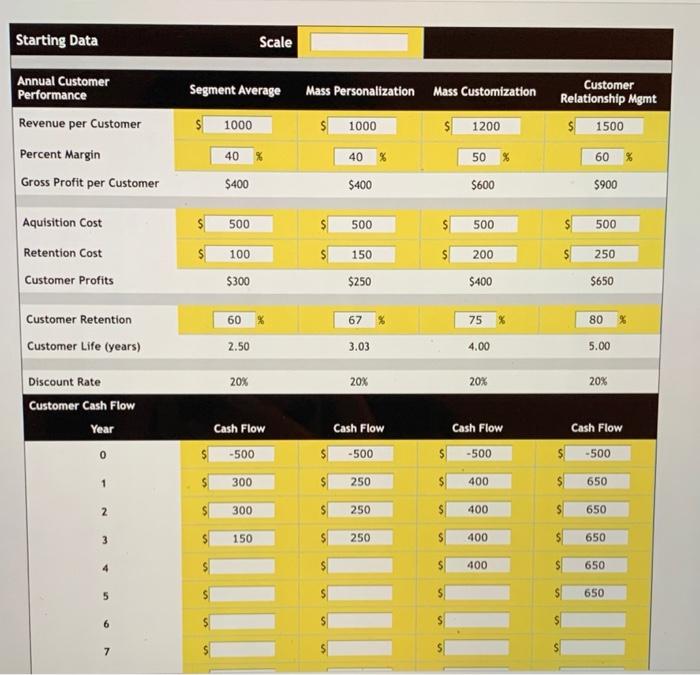
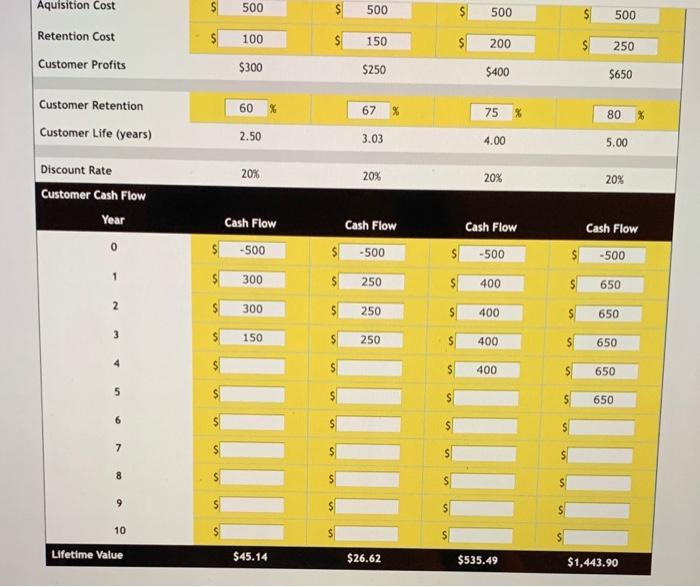
Help!! In hurry! please help 5.5.1 and 5.5.2 Customer Relationship Marketing 551 Using the data provided, estimate how customer profitability and lifetime value change for
Help!! In hurry! 


please help 5.5.1 and 5.5.2 
Customer Relationship Marketing 551 Using the data provided, estimate how customer profitability and lifetime value change for the mass-personalization programit the customer retention dropped from 67 to 60 percent 5:52. At what level of percent margin would the mass-customization program no longer produce a positive customer profit? Segment Average Mass Personalization Mass Customization Annual Customer Performance Revenue per Customer Percent Margin Gross Profit per Customer $ 1000 Customer Relationship Mgmt 1500 $ 1000 1200 40 40 50 % 60% $400 $400 $600 $900 500 500 500 500 Aquisition Cost Retention Cost Customer Profits 100 $ 150 200 250 $300 $250 $400 $650 60 67 % Customer Retention Customer Life (years) 75 % 80 X 2.50 3.03 4.00 5.00 20% 20% 20% Discount Rate Customer Cash Flow 20% Year Cash Flow Cash Flow -500 300 Cash Flow -500 0 Cash Flow -500 -500 1 250 400 650 2 300 250 400 650 3 150 250 400 650 4 400 650 5 650 6 7 8 Customer Cash Flow Year Cash Flow Cash Flow Cash Flow 0 -500 Cash Flow -500 -500 -500 $ $ 1 300 250 400 650 2 300 250 400 650 3 $ $ $ $ $ $ $ $ $ 150 $ 250 400 650 4 400 650 5 650 6 7 S 8 9 10 Lifetime Value $45.14 $26.62 $535.49 $1,443.90 Starting Data Scale Segment Average Mass Personalization Mass Customization Customer Relationship Mgmt 1500 $ Annual Customer Performance Revenue per Customer Percent Margin Gross Profit per Customer 1000 $ 1000 1200 40 40 % 50% $600 60 $900 $400 $400 Aquisition Cost $ 500 $ 500 500 500 Retention Cost 100 S 150 200 250 Starting Data Scale Segment Average Mass Personalization Mass Customization Annual Customer Performance Revenue per Customer Percent Margin Gross Profit per Customer Customer Relationship Mgmt 1500 1000 $1000 1200 40% 40 % 60 % 50 % $600 $400 $400 5900 Aquisition Cost 500 500 500 500 150 200 250 Retention Cost Customer Profits 100 $300 $250 $400 $650 60 67 % 75 % 80 Customer Retention Customer Life (years) 2.50 3.03 4.00 5.00 20% 20% 20% 20% Discount Rate Customer Cash Flow Year Cash Flow Cash Flow -500 Cash Flow S-500 Cash Flow -500 0 -500 1 300 250 400 650 2 300 250 400 650 3 150 250 400 650 4 400 650 5 650 6 7 Aquisition Cost 500 500 5 500 500 $ 100 150 200 250 Retention Cost Customer Profits $300 $250 $400 $650 60 % 67 75 Customer Retention Customer Life (years) % 80 % 2.50 3.03 4.00 5.00 20% Discount Rate Customer Cash Flow 20% 20% 20% Year Cash Flow Cash Flow Cash Flow Cash Flow -500 0 -500 -500 -500 1 300 250 400 650 2 300 250 400 650 150 250 S 400 650 $ 400 650 5 650 6 7 8 9 10 Lifetime Value $45.14 $26.62 $535.49 $1,443.90 percent? o percent of in an emort to increase market share from 5.5 Customer Relationship Marketing 551 Using the data provided, estimate how customer profitability and fetime value change for the mass personalization programit the customer retention dropped from 67 to 60 percent 552 At what level of percent margin would the mass-customcation program no longer produce a positive customer profit? 5.1 Cost Advantage Customer Relationship Marketing 551 Using the data provided, estimate how customer profitability and lifetime value change for the mass-personalization programit the customer retention dropped from 67 to 60 percent 5:52. At what level of percent margin would the mass-customization program no longer produce a positive customer profit? Segment Average Mass Personalization Mass Customization Annual Customer Performance Revenue per Customer Percent Margin Gross Profit per Customer $ 1000 Customer Relationship Mgmt 1500 $ 1000 1200 40 40 50 % 60% $400 $400 $600 $900 500 500 500 500 Aquisition Cost Retention Cost Customer Profits 100 $ 150 200 250 $300 $250 $400 $650 60 67 % Customer Retention Customer Life (years) 75 % 80 X 2.50 3.03 4.00 5.00 20% 20% 20% Discount Rate Customer Cash Flow 20% Year Cash Flow Cash Flow -500 300 Cash Flow -500 0 Cash Flow -500 -500 1 250 400 650 2 300 250 400 650 3 150 250 400 650 4 400 650 5 650 6 7 8 Customer Cash Flow Year Cash Flow Cash Flow Cash Flow 0 -500 Cash Flow -500 -500 -500 $ $ 1 300 250 400 650 2 300 250 400 650 3 $ $ $ $ $ $ $ $ $ 150 $ 250 400 650 4 400 650 5 650 6 7 S 8 9 10 Lifetime Value $45.14 $26.62 $535.49 $1,443.90 Starting Data Scale Segment Average Mass Personalization Mass Customization Customer Relationship Mgmt 1500 $ Annual Customer Performance Revenue per Customer Percent Margin Gross Profit per Customer 1000 $ 1000 1200 40 40 % 50% $600 60 $900 $400 $400 Aquisition Cost $ 500 $ 500 500 500 Retention Cost 100 S 150 200 250 Starting Data Scale Segment Average Mass Personalization Mass Customization Annual Customer Performance Revenue per Customer Percent Margin Gross Profit per Customer Customer Relationship Mgmt 1500 1000 $1000 1200 40% 40 % 60 % 50 % $600 $400 $400 5900 Aquisition Cost 500 500 500 500 150 200 250 Retention Cost Customer Profits 100 $300 $250 $400 $650 60 67 % 75 % 80 Customer Retention Customer Life (years) 2.50 3.03 4.00 5.00 20% 20% 20% 20% Discount Rate Customer Cash Flow Year Cash Flow Cash Flow -500 Cash Flow S-500 Cash Flow -500 0 -500 1 300 250 400 650 2 300 250 400 650 3 150 250 400 650 4 400 650 5 650 6 7 Aquisition Cost 500 500 5 500 500 $ 100 150 200 250 Retention Cost Customer Profits $300 $250 $400 $650 60 % 67 75 Customer Retention Customer Life (years) % 80 % 2.50 3.03 4.00 5.00 20% Discount Rate Customer Cash Flow 20% 20% 20% Year Cash Flow Cash Flow Cash Flow Cash Flow -500 0 -500 -500 -500 1 300 250 400 650 2 300 250 400 650 150 250 S 400 650 $ 400 650 5 650 6 7 8 9 10 Lifetime Value $45.14 $26.62 $535.49 $1,443.90 percent? o percent of in an emort to increase market share from 5.5 Customer Relationship Marketing 551 Using the data provided, estimate how customer profitability and fetime value change for the mass personalization programit the customer retention dropped from 67 to 60 percent 552 At what level of percent margin would the mass-customcation program no longer produce a positive customer profit? 5.1 Cost Advantage 
Step by Step Solution
There are 3 Steps involved in it
Step: 1

Get Instant Access to Expert-Tailored Solutions
See step-by-step solutions with expert insights and AI powered tools for academic success
Step: 2

Step: 3

Ace Your Homework with AI
Get the answers you need in no time with our AI-driven, step-by-step assistance
Get Started


