Measures of liquidity, solvency; and profitability The comparative financial statements of Marshall Inc. are as follows. The market price
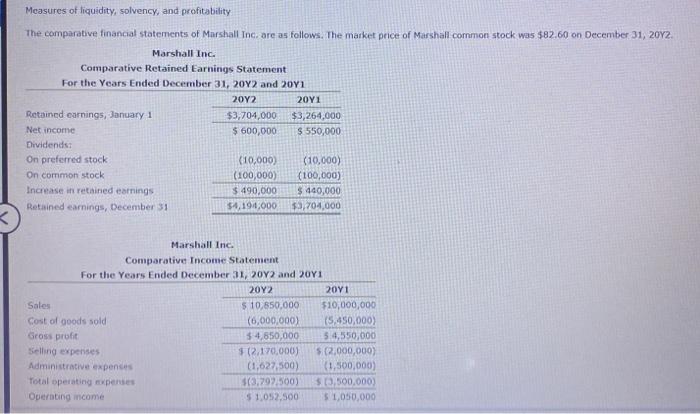
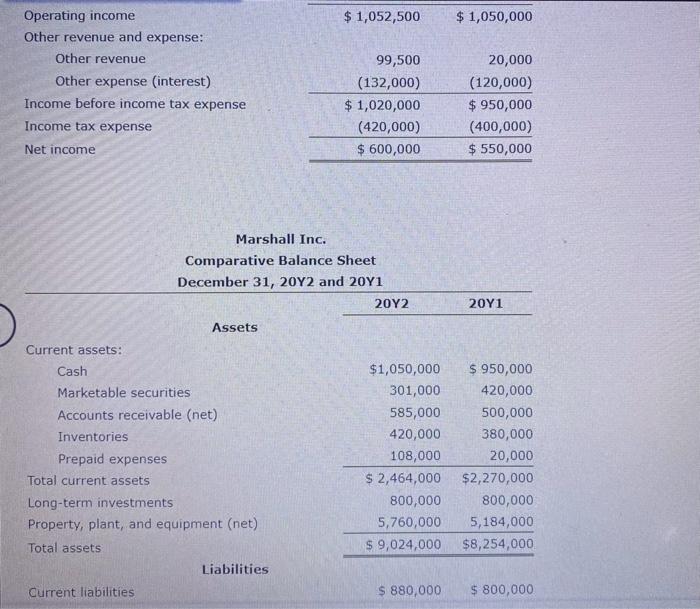
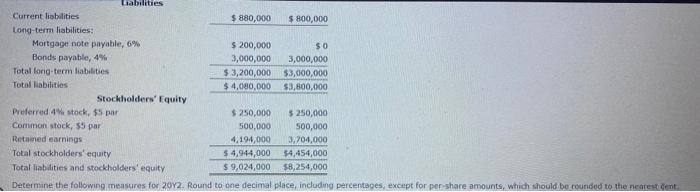
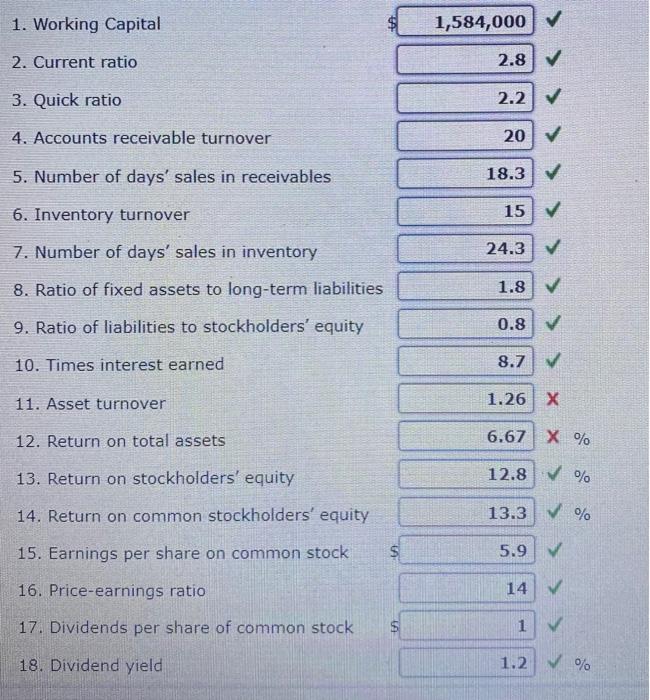
 of Marshall cornmon stock was $82.60 on December 31, 20Y2. Operating income Other revenue and expense: Other revenue \begin{tabular}{rr} 99,500 & 20,000 \\ (132,000) & (120,000) \\ \hline 1,020,000 & $950,000 \\ (420,000) & (400,000) \\ \hline$600,000 & $550,000 \\ \hline \end{tabular} Marshall Inc. Comparative Balance Sheet December 31,20Y2 and 20Y1 Assets Current assets: \begin{tabular}{lrr} Cash & $1,050,000 & $950,000 \\ Marketable securities & 301,000 & 420,000 \\ Accounts receivable (net) & 585,000 & 500,000 \\ Inventories & 420,000 & 380,000 \\ Prepaid expenses & 108,000 & 20,000 \\ \hline Total current assets & $2,464,000 & $2,270,000 \\ Long-term investments & 800,000 & 800,000 \\ Property, plant, and equipment (net) & 5,760,000 & 5,184,000 \\ \hline Total assets & $9,024,000 & $8,254,000 \\ \hline \end{tabular} Liabilities Current liabilities $880,000$800,000 Current lisbalities Long-term liabilities: Mortgage note payable, 6% Bonds payable, 4% Total long-term liabilities Total labilities Determine the following measures for 20Y2. Round to one decimal place, including percentages, except for per-share amounts, which should be rounded to the nearet cent: 1. Working Capital 2. Current ratio 3. Quick ratio 4. Accounts receivable turnover 5. Number of days' sales in receivables 2.82.22018.3 6. Inventory turnover 7. Number of days' sales in inventory 1524.3 8. Ratio of fixed assets to long-term liabilities 9. Ratio of liabilities to stockholders' equity 10. Times interest earned 11. Asset turnover 12. Return on total assets 13. Return on stockholders' equity 14. Return on common stockholders' equity 13.3 15. Earnings per share on common stock 16. Price-earnings ratio 17. Dividends per share of common stock 18. Dividend yield 1.2%