

Question
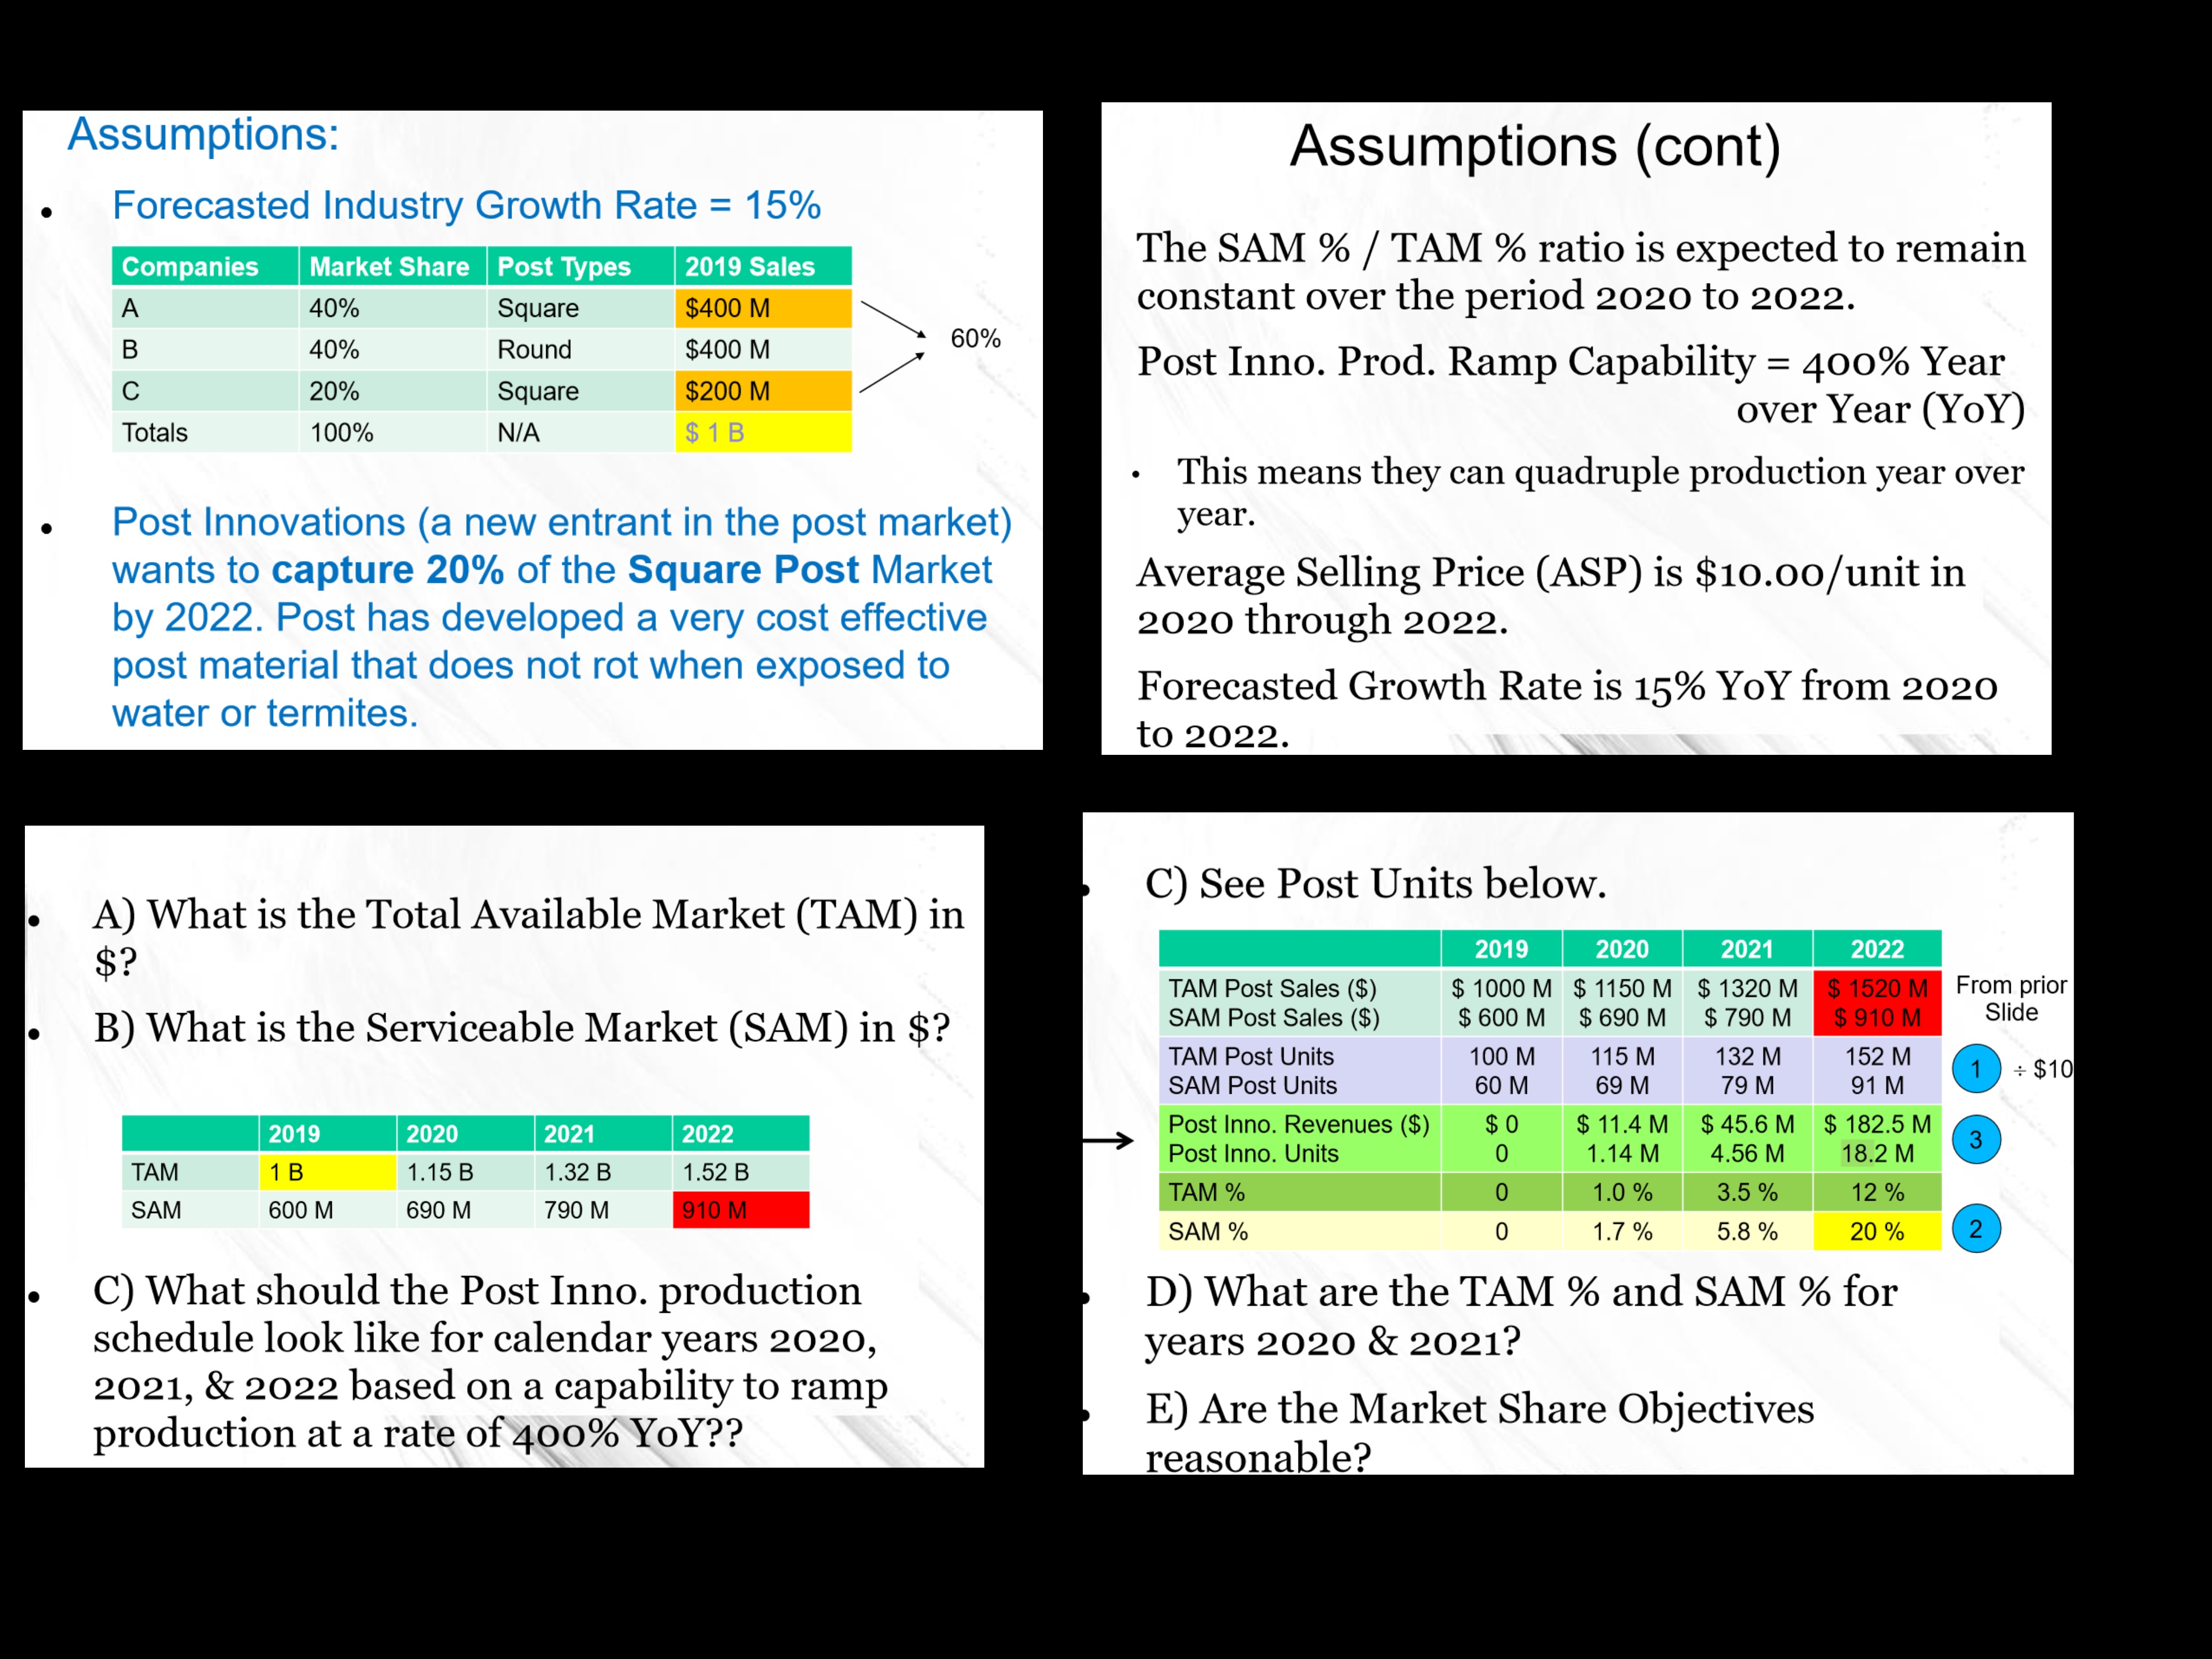
HELP MARKETING EXPERTS! (intro 2 marketing Q) NEED HELP WITH THIS STUDY GUIDE QUESTION RELATED TO TAMS/SAMS. The screenshots includes hints and prof explained it
HELP MARKETING EXPERTS! (intro 2 marketing Q) NEED HELP WITH THIS STUDY GUIDE QUESTION RELATED TO TAMS/SAMS. The screenshots includes hints and prof explained it real quick and couldn`t go back and I never took a marketing class and this isn't in the lesson! I know they said for part E) IT IS MORE OF A CRITICAL THINKING Q and that although it jumps from 5.8% to 20% it is still "within reason". For the beginning questions I know he took 20% of 910 M (highlighted in red from the char) and got 18.2 M and divided by 4 (is this bc there is 4 years) then he divided the result 1.14 from
Step by Step Solution
There are 3 Steps involved in it
Step: 1

Get Instant Access to Expert-Tailored Solutions
See step-by-step solutions with expert insights and AI powered tools for academic success
Step: 2

Step: 3
Ace Your Homework with AI
Get the answers you need in no time with our AI-driven, step-by-step assistance
Get Started
Consumer Behavior Buying, Having and Being
Authors: Michael R. Solomon
11th edition
978-0133451153, 133450899, 133451151, 978-0133450897