

Answered step by step
Verified Expert Solution
Question
1 Approved Answer
HELP MATLAB!! URGENT please write the code clearly from q1a-q1e thanks !!! Q1b In the cumultrap.m file, complete the function file to perform cumulative integration
HELP MATLAB!! URGENT
please write the code clearly from q1a-q1e
thanks !!!
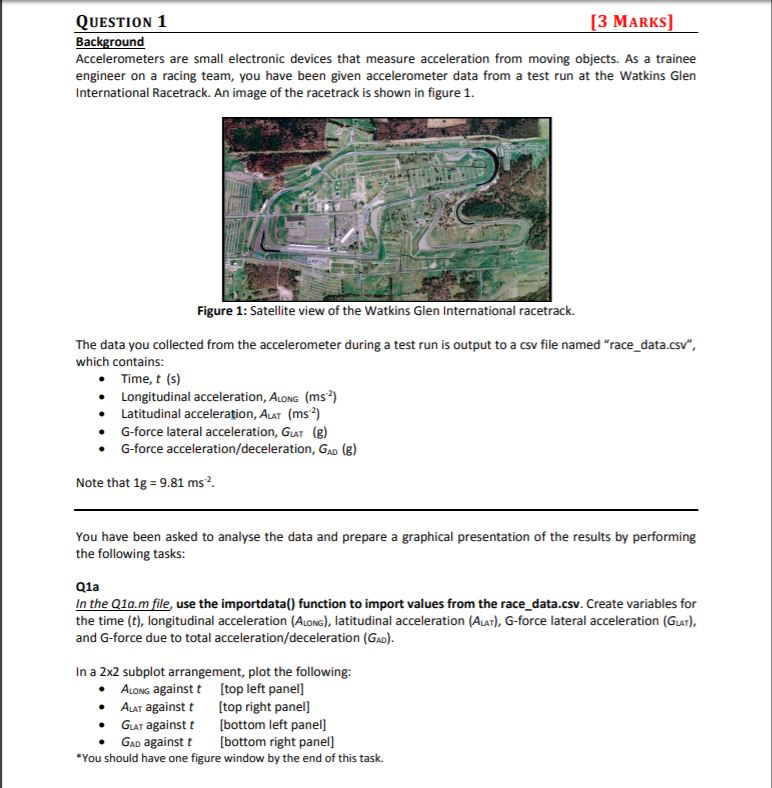
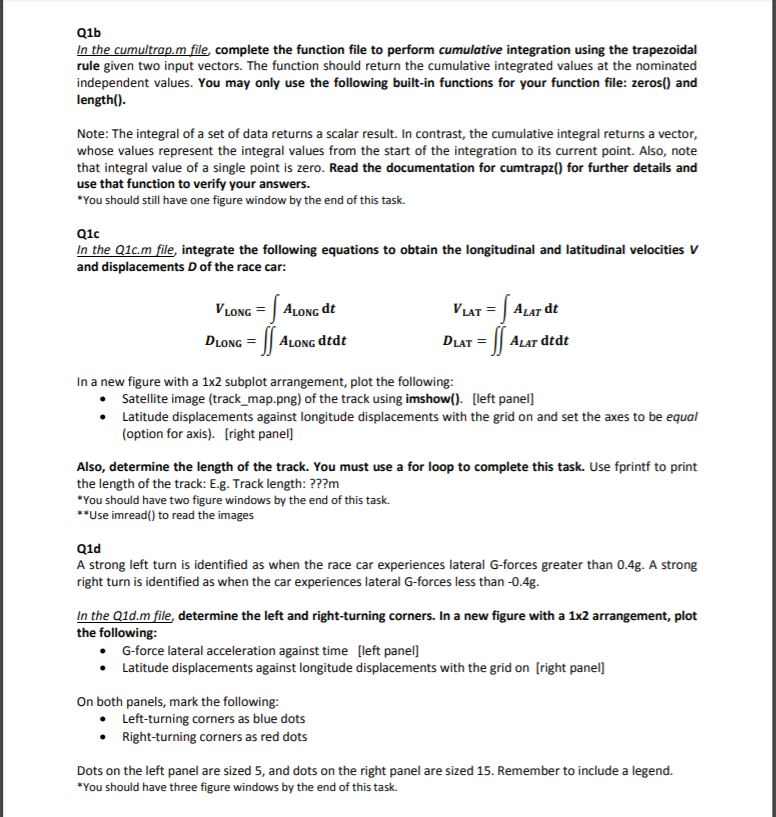
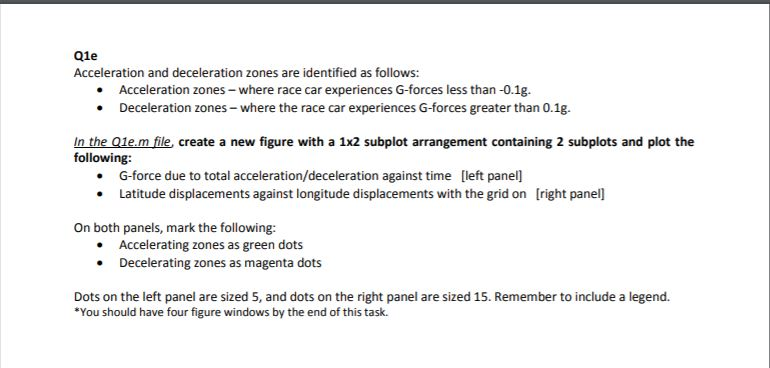
Q1b In the cumultrap.m file, complete the function file to perform cumulative integration using the trapezoidal rule given two input vectors. The function should return the cumulative integrated values at the nominated independent values. You may only use the following built-in functions for your function file: zeros) and length(). Note: The integral of a set of data returns a scalar result. In contrast, the cumulative integral returns a vector, whose values represent the integral values from the start of the integration to its current point. Also, note that integral value of a single point is zero. Read the documentation for cumtrapz() for further details and use that function to verify your answers. You should still have one figure window by the end of this task. Q1c In the Q1c.m file, integrate the following equations to obtain the longitudinal and latitudinal velocities V and displacements D of the race car: LONG ALONG dt DLONGALONG dtdt DLAT ALAT dtdt In a new figure with a 1x2 subplot arrangement, plot the following .Satellite image (track map.png) of the track using imshow() left panel] Latitude displacements against longitude displacements with the grid on and set the axes to be equal (option for axis). [right panel] Also, determine the length of the track. You must use a for loop to complete this task. Use fprintf to print the length of the track: E.g. Track length: ???m You should have two figure windows by the end of this task. Use imread() to read the images Q1d A strong left turn is identified as when the race car experiences lateral G-forces greater than 0.4g. A strong right turn is identified as when the car experiences lateral G-forces less than -0.4g. In the Q1d.m file, determine the left and right-turning corners. In a new figure with a 1x2 arrangement, plot the following .G-force lateral acceleration against time [left panell Latitude displacements against longitude displacements with the grid on [right panel] On both panels, mark the following: Left-turning corners as blue dots . Right-turning corners as red dots Dots on the left panel are sized 5, and dots on the right panel are sized 15. Remember to include a legend. You should have three figure windows by the end of this task. Q1e Acceleration and deceleration zones are identified as follows: Acceleration zones-where race car experiences G-forces less than -0.1g. Deceleration zones-where the race car experiences G-forces greater than 0.1g. In the Q1e.m file, create a new figure with a 1x2 subplot arrangement containing 2 subplots and plot the following G-force due to total acceleration/deceleration against time [left panel] Latitude displacements against longitude displacements with the grid on [right panel] On both panels, mark the following: Accelerating zones as green dots Decelerating zones as magenta dots Dots on the left panel are sized 5, and dots on the right panel are sized 15. Remember to include a legend. *You should have four figure windows by the end of this task. Q1b In the cumultrap.m file, complete the function file to perform cumulative integration using the trapezoidal rule given two input vectors. The function should return the cumulative integrated values at the nominated independent values. You may only use the following built-in functions for your function file: zeros) and length(). Note: The integral of a set of data returns a scalar result. In contrast, the cumulative integral returns a vector, whose values represent the integral values from the start of the integration to its current point. Also, note that integral value of a single point is zero. Read the documentation for cumtrapz() for further details and use that function to verify your answers. You should still have one figure window by the end of this task. Q1c In the Q1c.m file, integrate the following equations to obtain the longitudinal and latitudinal velocities V and displacements D of the race car: LONG ALONG dt DLONGALONG dtdt DLAT ALAT dtdt In a new figure with a 1x2 subplot arrangement, plot the following .Satellite image (track map.png) of the track using imshow() left panel] Latitude displacements against longitude displacements with the grid on and set the axes to be equal (option for axis). [right panel] Also, determine the length of the track. You must use a for loop to complete this task. Use fprintf to print the length of the track: E.g. Track length: ???m You should have two figure windows by the end of this task. Use imread() to read the images Q1d A strong left turn is identified as when the race car experiences lateral G-forces greater than 0.4g. A strong right turn is identified as when the car experiences lateral G-forces less than -0.4g. In the Q1d.m file, determine the left and right-turning corners. In a new figure with a 1x2 arrangement, plot the following .G-force lateral acceleration against time [left panell Latitude displacements against longitude displacements with the grid on [right panel] On both panels, mark the following: Left-turning corners as blue dots . Right-turning corners as red dots Dots on the left panel are sized 5, and dots on the right panel are sized 15. Remember to include a legend. You should have three figure windows by the end of this task. Q1e Acceleration and deceleration zones are identified as follows: Acceleration zones-where race car experiences G-forces less than -0.1g. Deceleration zones-where the race car experiences G-forces greater than 0.1g. In the Q1e.m file, create a new figure with a 1x2 subplot arrangement containing 2 subplots and plot the following G-force due to total acceleration/deceleration against time [left panel] Latitude displacements against longitude displacements with the grid on [right panel] On both panels, mark the following: Accelerating zones as green dots Decelerating zones as magenta dots Dots on the left panel are sized 5, and dots on the right panel are sized 15. Remember to include a legend. *You should have four figure windows by the end of this task
Step by Step Solution
There are 3 Steps involved in it
Step: 1

Get Instant Access to Expert-Tailored Solutions
See step-by-step solutions with expert insights and AI powered tools for academic success
Step: 2

Step: 3
Ace Your Homework with AI
Get the answers you need in no time with our AI-driven, step-by-step assistance
Get Started
Oracle 12c SQL
Authors: Joan Casteel
3rd edition
1305251032, 978-1305251038