Answered step by step
Verified Expert Solution
Question
1 Approved Answer
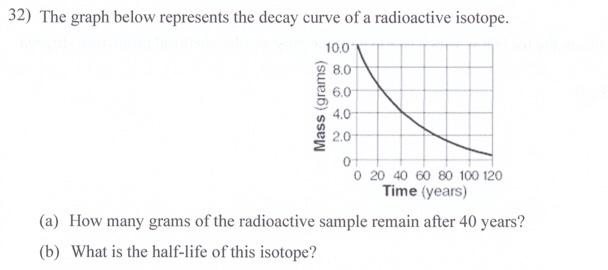
help me! 32) The graph below represents the decay curve of a radioactive isotope. 10,0 8.0 6.0 Mass (grams) 4.0 2.0 01 0 20 40
help me! 
32) The graph below represents the decay curve of a radioactive isotope. 10,0 8.0 6.0 Mass (grams) 4.0 2.0 01 0 20 40 60 80 100 120 Time (years) (a) How many grams of the radioactive sample remain after 40 years? (b) What is the half-life of this isotope 
Step by Step Solution
There are 3 Steps involved in it
Step: 1

Get Instant Access to Expert-Tailored Solutions
See step-by-step solutions with expert insights and AI powered tools for academic success
Step: 2

Step: 3

Ace Your Homework with AI
Get the answers you need in no time with our AI-driven, step-by-step assistance
Get Started


