

Question: Help me answer the following question as I do not understand them with clear explanation Graphical Analysis In Exercises 19 and 20, use the frequency
Help me answer the following question as I do not understand them with clear explanation
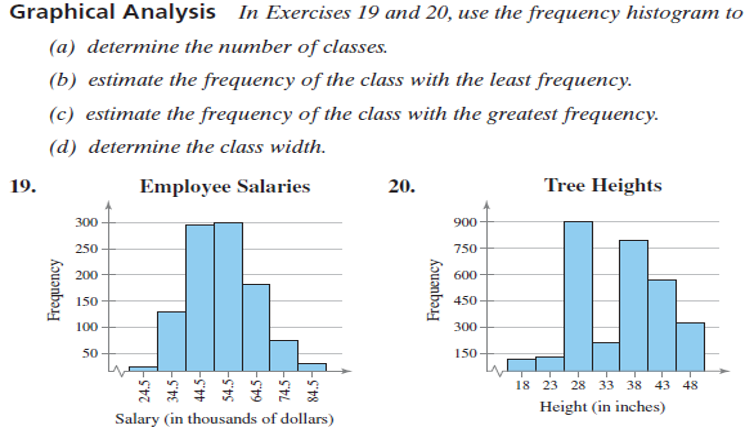
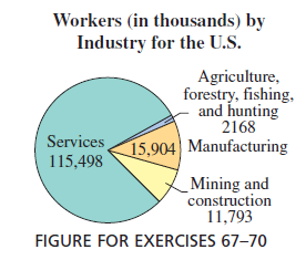
Graphical Analysis In Exercises 19 and 20, use the frequency histogram to (a) determine the number of classes. (b) estimate the frequency of the class with the least frequency. (c) estimate the frequency of the class with the greatest frequency. (d) determine the class width. 19. Employee Salaries 20. Tree Heights 300 900 250 750 Frequency 200 600 150 450 100 Frequency 300 50 150 18 23 28 33 38 43 48 Salary (in thousands of dollars) Height (in inches)\fWorkers (in thousands) by Industry for the U.S. Agriculture, forestry, fishing. and hunting Services 2168 115.498 15,904 Manufacturing Mining and construction 11,793 FIGURE FOR EXERCISES 67-70
Step by Step Solution
There are 3 Steps involved in it

Get step-by-step solutions from verified subject matter experts