

Question: help me answer the following question as I do not understand them with clear explanation Graphical Analysis In Exercises 19 and 20, use the frequency
help me answer the following question as I do not understand them with clear explanation
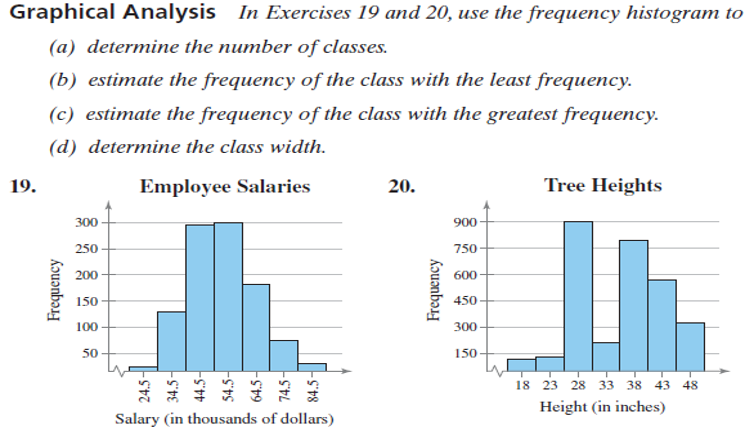
Graphical Analysis In Exercises 19 and 20, use the frequency histogram to (a) determine the number of classes. (b) estimate the frequency of the class with the least frequency. (c) estimate the frequency of the class with the greatest frequency. (d) determine the class width. 19. Employee Salaries 20. Tree Heights 300 900 250 750 Frequency 200 600 150 450 100 Frequency 300 50 150 18 23 28 33 38 43 48 Salary (in thousands of dollars) Height (in inches)\f
Step by Step Solution
There are 3 Steps involved in it
1 Expert Approved Answer
Step: 1 Unlock

Question Has Been Solved by an Expert!
Get step-by-step solutions from verified subject matter experts
Step: 2 Unlock
Step: 3 Unlock