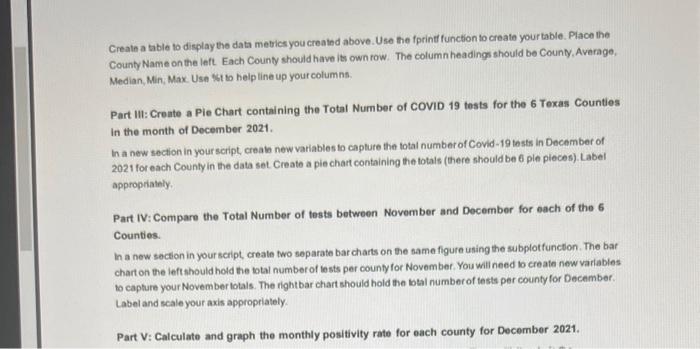
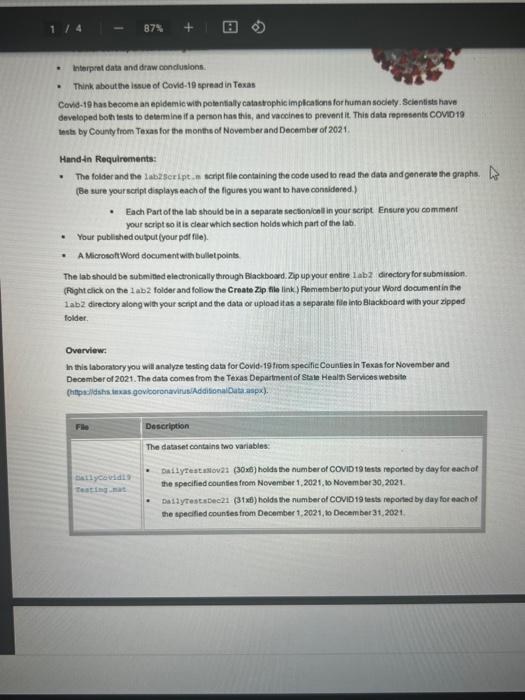
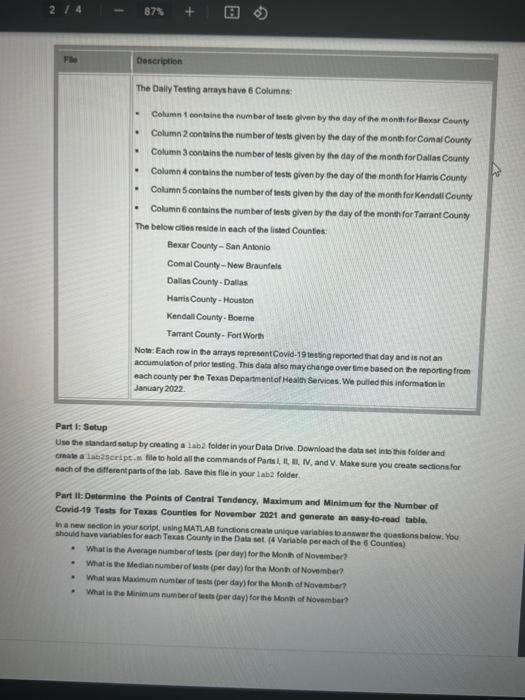
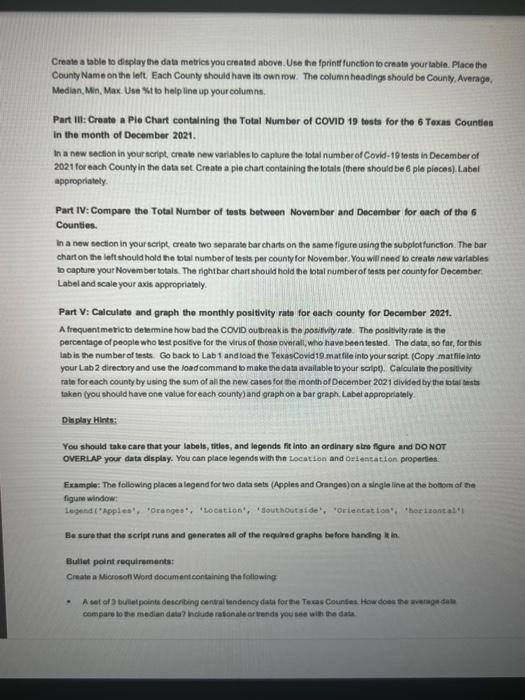
Create a table to dieplay the data metrics you creatied above. Use the fprintf function to create yourtable. Place the County Name on the left. Each County should have its own row. The columnheadings should be County, Average, Median, Min, Max. Use fit to help line up your columns. Part III: Create a Pie Chart containing the Total Number of COVID 19 tests for the 6 Texas Counties In the month of December 2021. In a new section in your script, creabe new variables to capture the total number of Covid-19 tests in December of 2021 for each Countyin the data set. Create a pie chart containing the totals (there should be 6 pie pieces). Label appropriately. Part IV: Compare the Total Number of tests between November and December for each of the 6 Counties. In a new section in your script, create two separate bar charts on the same figure using the subplotfunction. The bar chart on the left should hold the total number of tests per county for Novembet. You will need lo create new variables to capture your November totals. The rightbar chart should hold the letal number of tests per county for December. Label and scale your axis appropriately. - Tnterprot data and draw conclusions: - Think about the issue of Covid-19 spread in Texas Covid-19 has become an epidamic with potentialy catastophic impleations for human society. Selentists have developed both tests to determine if a person has thin, and vaccines to prevent it. This data reptesents Covio 19 Insta by County from Texas for the monthe of November and December of 2021. Handin Requirements: The folder and the labiseript, in script file containing the oode used to read the data and ganerate the graphs. (Be sure yourscript displays each of the figures you want to have considered) - Each Part of the lab should be in a separate sectonicnil in your seript. Ensure you comment your script so it is dear which secten holds which part of the lab. Your published oulput(your pof file). - AMsicrotoftWord documentwith bulletpoints. The labshould be submibed elinctronically through Biackbosed. 2p, up your entire 1 ab 2 irectory for submission. (Fight click on the 1 ab 2 folder and follow the Create 2ip tile link) Femember lo put your Word document in the 1 ab2 directoty along with your serpt and the data or upioad it as a separate file inlo Blackboard with your zipped folider. Overview4 In this laboratory you will analyze testing daba for Covid-19 from specific Counlies in Texas for November and December of 2021. The data comes from be Texas Departmenf of Stale Health Services websile (Rifperelidshs inxas govboronavirus/Addisonal Data aspox). The Daily Testing arrays have 6 Columns: Colamn 1 containe the number of loek given by the day of the month for Baxar County Column 2 contains the number of tests given by the day of the month for Comat County Column 3 contains the number of lesss given by the day of the month for Dallas County Colamn 4 contains the number of lests given by the day of the month for Haris County Column 5 contains the number of insts given by the day of the month for Kendall County Column 6 contains the number of insts given by the day of the month for Tarrant Counly The below cites reside in each of the listed Countes: Bexar Ceunfy - San Antonio Comal County - New Braunfels Dallas County-Dallas Hamis County - Houston Kendall County-Boerne Tartant County- Fort Worth Notn: Each row in the arrays represont Covid-19 testing reporend that day and is not an accumulabon of prior tnsfing. This data also maychange over ime based on the neparting trom each county per the Texat Department of Mealth Services. We puiled this information in January 2022. Part i: Setup Use the standand solup by creating a lab2 folder in your Data Drive. Download the data set into this folder and cmate a labascript, wile to hold all the commands of Parts i, 11, Mit, N, and V. Make sure you create sections for nach of the eifterentparts of the lab. Bave this file in your 1 abe folder. Part It: Determine the Points of Central Tendency, Maximum and Minimum for the Number of Covid-19 Tests for Texas Counties for November 2021 and generate an easy-to-read table. In a new sectica in your scipt, uning MATLA functons creatn unique variabies banwar the queskans balow. Your bhould have varabies for each Texas County in the Data set. (4 Variable per nach of the 6 Countes). - What is the Average nimberof iests (per day) for the Month of Novnember? - What is the Mediannumber of lents (per day) far thn Month of November? - What was Maximum numiter of ieats (per day) fer the Monh of Navember? - What is the Minimian number of leta (per day) for the Monei of November? Creabe a bble to display the data metrics you creatnd above. Use the fprinef function to crnate your kable. Place the County Name on the lelt. Each County should have its own row. The column headings should be County. Average, Median, Min, Max. Use Wt to heip line up your columns, Part Iil: Create a Ple Chart containing the Total Number of COVID 19 tosts for the 6 Texas Counties in the menth of December 2021. In a new section in your script, create new variables to capture the total number of Covid-19 tests in Decamber of 2021 tor each County in the data set. Create a pie chart containing the lotals (there should be 6 ple pioces) Label appropriately. Part IV: Compare the Total Number of tests between November and December for each of the 6 Counties. In a new section in your script, areate two separate bar charts on the same figure using the subplotfunction. The bar chat on the left should hold the venil number of tessts per counly for November. You will need o create new varlables to capture your November totais. The rightbar chartshould hold the btal number of thsss per countyfor December: Labeland scale your axis appropriately. Part V: Calculate and graph the monthly positivity rate for each county for Decomber 2021. A frequentmeric to delermine how bad the COvD oubreakis ne positvibrate. The posisvilyrate is the percentage of people who bst positve for the virus of those overall, who have been tesied. The data, so far, for this Iab is the number of tests. Co back to Labt and ioad the TexasCovids matfile into your script. (Copy matfile into your Lab 2 directory and use the load command b make the data avallable by your scip4. Calculate the positily rate for each county by using the sum of al the new cases for the month of December 2021 divided by the btal trass taken (you should have one value for each county) and graph on a bar graph. Labet appropriataly. Display Hints: You should take care that your labeis, thies, and legends fit into an ordinary sime fgure and DO NOT OVERLAP your data display. You can place logendswith thn Location and oxi encation properties. Example: The fellowing places a legend for two data sets (Apples and Oranges) on a single line at the botbom of the figure window: Legend'Apples", 'Oranges", "Location', 'Southpotside', 'orientation", "heeltantal') Be sure that the scrigt runs and generates all of the requred graphs before handing in in. Suliet point requirements: Crave a Microson Wiord document containing tha following: - A set af builetpointu descibing cenvai imndengy data for the Texas Countes thow does the arerage deale cempare to the median data? hichise rafonale or Yends yed sue with the data. A set of 3 bulletpoints describing the results of the poritivityrale graph. What does this mean? Describe any frends you might seo in the data and hypothesize on causes. A set of 3 bulletpoints descrbing the detailed characleristics of the Month-to-Month Comparison of besting Totais distribusonfor the Wo months (November and December) in the study. Include rationale or trends you see in the data. A short paragraph giking your opinion on the implicabons of this data. Include references to any differences you see betweendifferent months or sizes of the counties. Each bulletpoint should mention which figures (bylab part number) you used to do this. Focus on relovant observations such as trends, magnitudes, and variation expressed in terms of tha das. The bullet points and paragraph should be spell and grammar checked using Mictosoft
