help me pleasee
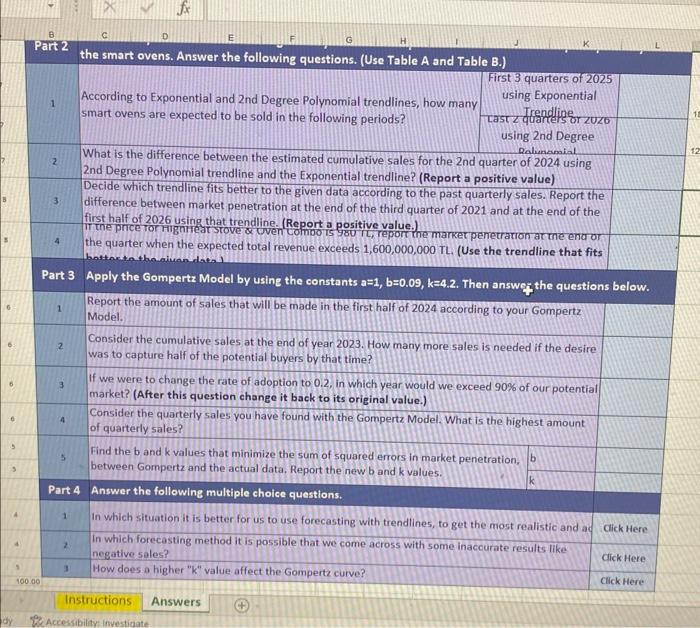
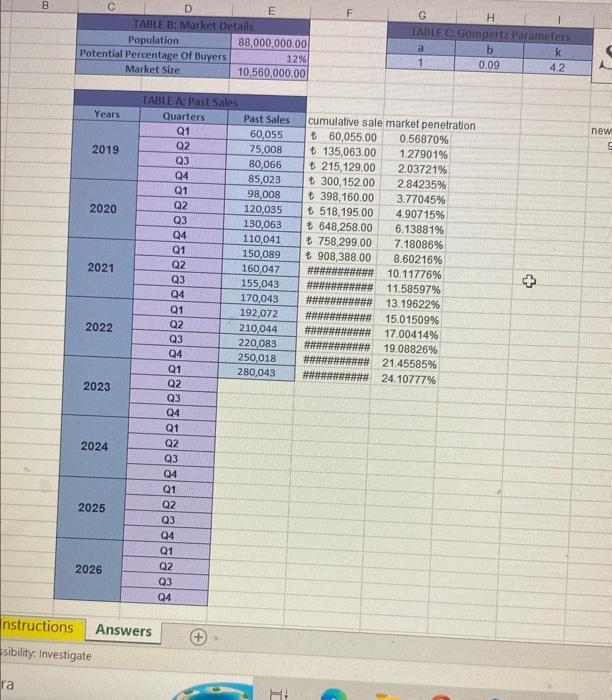
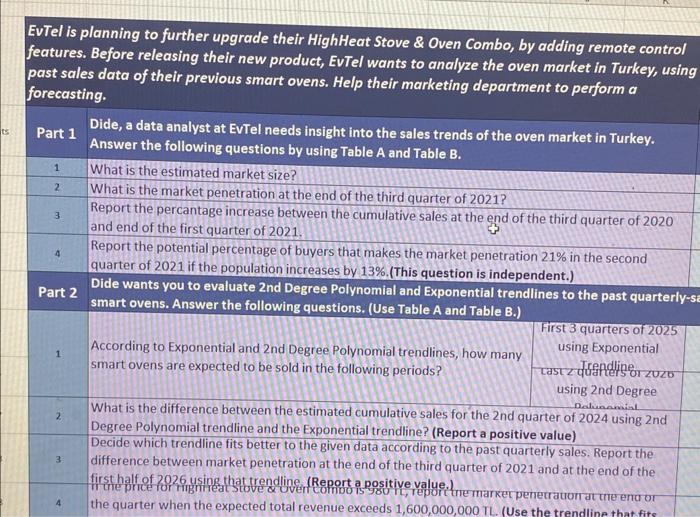
First 3 quarters of 2025 1 According to Exponential and 2nd Degree Polynomial trendlines, how many using Exponential smart ovens are expected to be sold in the following periods? Last Trendlige or zUzo using 2nd Degree Dalumamial 2 What is the difference between the estimated cumulative sales for the 2nd quarter of 2024 using 2nd Degree Polynomial trendline and the Exponential trendline? (Report a positive value) Decide which trendline fits better to the given data according to the past quarterly sales. Report the 3. difference between market penetration at the end of the third quarter of 2021 and at the end of the first half of 2026 using that trendline. (Report a positive value.) it the price ror Higntieat stove QOven Combois 980 I L, report the markec penetration at the end or 4 the quarter when the expected total revenue exceeds 1,600,000,000 TL. (Use the trendline that fits battactathonivandats Part 3 Apply the Gompertz Model by using the constants a=1,b=0.09,k=4.2. Then answer the questions below. Report the amount of sales that will be made in the first half of 2024 according to your Gompertz Model. Consider the cumulative sales at the end of year 2023. How many more sales is needed if the desire was to capture half of the potential buyers by that time? If we were to change the rate of adoption to 0.2 , in which year would we exceed 90% of our potential market? (After this question change it back to its orieinal value.) Consider the quarterly sales you have found with the Gompertz Model. What is the highest amount of quarterly sales? Find the b and k values that minimize the sum of squared errors in market penetration, b between Gompertz and the actual data. Report the new b and k values. Part 4 Answer the following multiple choice questions. 1 In which situation it is better for us to use forecasting with trendlines, to get the most realistic and ad Cick Here In which forecasting method it is possible that we come across with some inaccurate results like negative sales? Cick Here How does a higher " k " value affect the Gompertz curve? 100.00 Cilck Here Instructions Answers \begin{tabular}{|c|c|c|} \hline 3 & C & \multicolumn{1}{c|}{ E } \\ \cline { 1 - 3 } & TABLE B: Market Details \\ \hline Population & 88,000,000.00 \\ \hline Potential Percentage Of Buyers & 12% \\ \hline Market Sire & 10,560,000.00 \\ \hline \end{tabular} \begin{tabular}{|c|c|c|} \hline G & H & 1 \\ \hline INBIFCGompertr Parameters \\ \hlinea & b & k \\ \hline 1 & 0.09 & 4.2 \\ \hline \end{tabular} EvTel is planning to further upgrade their HighHeat Stove \& Oven Combo, by adding remote control features. Before releasing their new product, EvTel wants to analyze the oven market in Turkey, using past sales data of their previous smart ovens. Help their marketing department to perform a forecasting. Part 1 Dide, a data analyst at EvTel needs insight into the sales trends of the oven market in Turkey. Answer the following questions by using Table A and Table B. \begin{tabular}{|l|l|} \hline 1 & What is the estimated market size? \\ \hline 2 & What is the market petration \end{tabular} What is the market penetration at the end of the third quarter of 2021 ? Report the percantage increase between the cumulative sales at the end of the third quarter of 2020 and end of the first quarter of 2021. Report the potential percentage of buyers that makes the market penetration 21% in the second quarter of 2021 if the population increases by 13%.(This question is independent.) Dide wants you to evaluate 2nd Degree Polynomial and Exponential trendlines to the past quarterly-si smart ovens. Answer the following questions. (Use Table A and Table B.) First 3 quarters of 2025 1 According to Exponential and 2nd Degree Polynomial trendlines, how many using Exponential smart ovens are expected to be sold in the following periods? What is the difference between the estimated cumulative sales for the 2 nd quarter of 2024 using 2 nd Degree Polynomial trendline and the Exponential trendline? (Report a positive value) Decide which trendline fits better to the given data according to the past quarterly sales. Report the difference between market penetration at the end of the third quarter of 2021 and at the end of the first half of 2026 using that trendline (Report a positive value.) First 3 quarters of 2025 1 According to Exponential and 2nd Degree Polynomial trendlines, how many using Exponential smart ovens are expected to be sold in the following periods? Last Trendlige or zUzo using 2nd Degree Dalumamial 2 What is the difference between the estimated cumulative sales for the 2nd quarter of 2024 using 2nd Degree Polynomial trendline and the Exponential trendline? (Report a positive value) Decide which trendline fits better to the given data according to the past quarterly sales. Report the 3. difference between market penetration at the end of the third quarter of 2021 and at the end of the first half of 2026 using that trendline. (Report a positive value.) it the price ror Higntieat stove QOven Combois 980 I L, report the markec penetration at the end or 4 the quarter when the expected total revenue exceeds 1,600,000,000 TL. (Use the trendline that fits battactathonivandats Part 3 Apply the Gompertz Model by using the constants a=1,b=0.09,k=4.2. Then answer the questions below. Report the amount of sales that will be made in the first half of 2024 according to your Gompertz Model. Consider the cumulative sales at the end of year 2023. How many more sales is needed if the desire was to capture half of the potential buyers by that time? If we were to change the rate of adoption to 0.2 , in which year would we exceed 90% of our potential market? (After this question change it back to its orieinal value.) Consider the quarterly sales you have found with the Gompertz Model. What is the highest amount of quarterly sales? Find the b and k values that minimize the sum of squared errors in market penetration, b between Gompertz and the actual data. Report the new b and k values. Part 4 Answer the following multiple choice questions. 1 In which situation it is better for us to use forecasting with trendlines, to get the most realistic and ad Cick Here In which forecasting method it is possible that we come across with some inaccurate results like negative sales? Cick Here How does a higher " k " value affect the Gompertz curve? 100.00 Cilck Here Instructions Answers \begin{tabular}{|c|c|c|} \hline 3 & C & \multicolumn{1}{c|}{ E } \\ \cline { 1 - 3 } & TABLE B: Market Details \\ \hline Population & 88,000,000.00 \\ \hline Potential Percentage Of Buyers & 12% \\ \hline Market Sire & 10,560,000.00 \\ \hline \end{tabular} \begin{tabular}{|c|c|c|} \hline G & H & 1 \\ \hline INBIFCGompertr Parameters \\ \hlinea & b & k \\ \hline 1 & 0.09 & 4.2 \\ \hline \end{tabular} EvTel is planning to further upgrade their HighHeat Stove \& Oven Combo, by adding remote control features. Before releasing their new product, EvTel wants to analyze the oven market in Turkey, using past sales data of their previous smart ovens. Help their marketing department to perform a forecasting. Part 1 Dide, a data analyst at EvTel needs insight into the sales trends of the oven market in Turkey. Answer the following questions by using Table A and Table B. \begin{tabular}{|l|l|} \hline 1 & What is the estimated market size? \\ \hline 2 & What is the market petration \end{tabular} What is the market penetration at the end of the third quarter of 2021 ? Report the percantage increase between the cumulative sales at the end of the third quarter of 2020 and end of the first quarter of 2021. Report the potential percentage of buyers that makes the market penetration 21% in the second quarter of 2021 if the population increases by 13%.(This question is independent.) Dide wants you to evaluate 2nd Degree Polynomial and Exponential trendlines to the past quarterly-si smart ovens. Answer the following questions. (Use Table A and Table B.) First 3 quarters of 2025 1 According to Exponential and 2nd Degree Polynomial trendlines, how many using Exponential smart ovens are expected to be sold in the following periods? What is the difference between the estimated cumulative sales for the 2 nd quarter of 2024 using 2 nd Degree Polynomial trendline and the Exponential trendline? (Report a positive value) Decide which trendline fits better to the given data according to the past quarterly sales. Report the difference between market penetration at the end of the third quarter of 2021 and at the end of the first half of 2026 using that trendline (Report a positive value.)